Daniocell
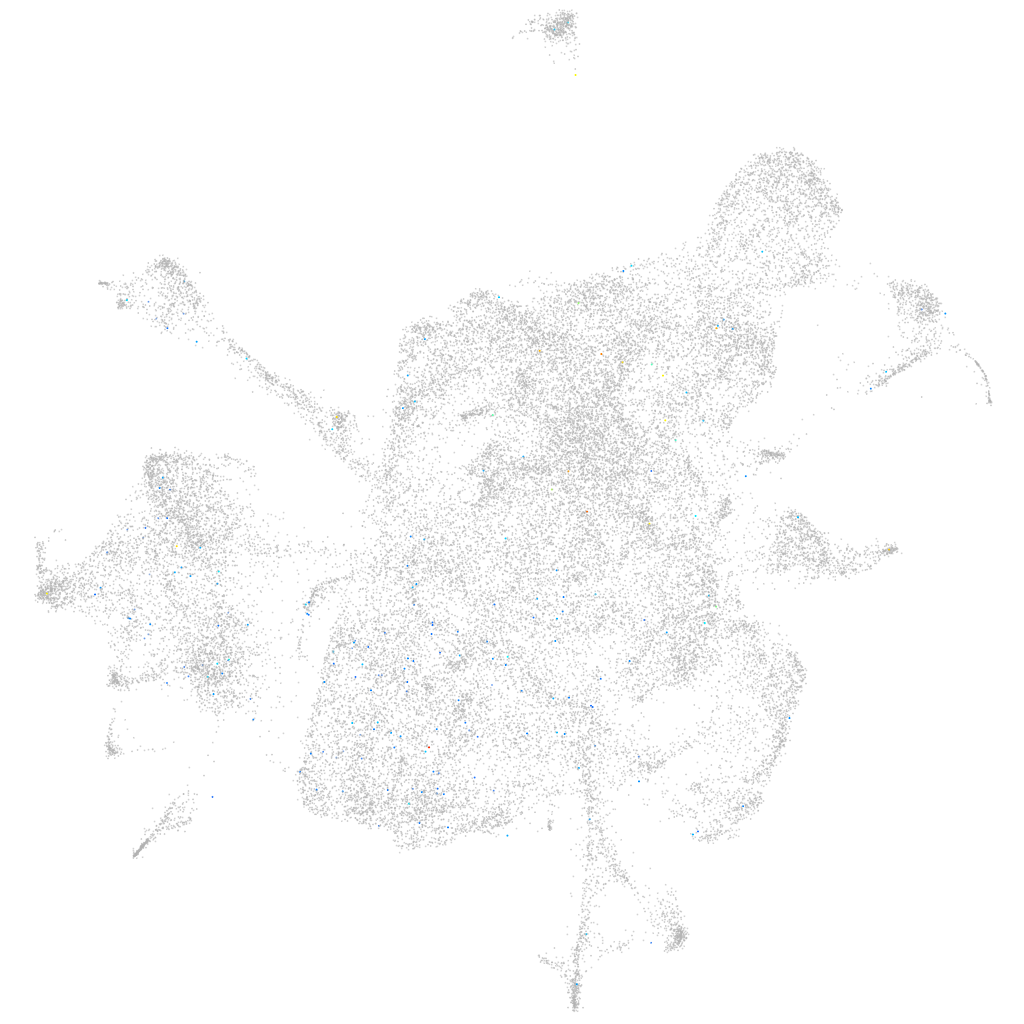
si:dkeyp-4f2.3 (mesenchyme)
si:dkeyp-4f2.3
ZFIN
Gene expression UMAP
Display:
Expression
Stage
Other cell groups
all cells
blastomeres
PGCs
endoderm
axial mesoderm
muscle
mural cells /
non-skeletal muscle
mesenchyme
hematopoietic /
vasculature
pronephros
neural
spinal cord / glia
eye
taste / olfactory
otic / lateral line
epidermis
periderm
fin
ionocytes / mucous
pigment cells
Expression by stage/cluster
Correlated gene expression
Positive correlation
Negative correlation
Gene
r
Gene
r
LOC108183376
0.138
bhmt
-0.015
LOC108182767
0.113
serpinh1b
-0.015
CABZ01067150.1
0.098
anxa4
-0.014
zgc:158427
0.097
cpn1
-0.014
si:dkeyp-27c8.1
0.096
rpz5
-0.014
NC-002333.2
0.096
col1a1b
-0.013
si:ch211-175m2.4
0.082
matn1
-0.013
AL929237.2
0.080
fgfbp2b
-0.013
LOC108180147
0.078
si:dkey-19b23.8
-0.013
LOC103909991
0.076
ponzr1
-0.013
nmba
0.067
col27a1b
-0.013
XLOC-036261
0.063
papss2b
-0.012
BX842669.1
0.059
mia
-0.012
si:dkey-19a16.16
0.055
col2a1a
-0.012
CR855206.2
0.055
uap1l1
-0.012
he1.1.1
0.055
tuft1a
-0.012
AL928724.1
0.054
sema3e
-0.012
BX323076.2
0.053
col9a3
-0.012
BX927369.1
0.053
krt18b
-0.012
CR384062.1
0.052
pgm1
-0.012
zgc:172133
0.052
epyc
-0.012
nitr1m
0.051
pvalb1
-0.012
olfcg3
0.051
klf2b
-0.011
LOC101884216
0.049
actc1b
-0.011
bco2b
0.049
col6a4a
-0.011
si:ch211-39f2.3
0.048
creb3l1
-0.011
prozb
0.048
wisp3
-0.011
CR933734.2
0.048
mylpfa
-0.011
BX927164.1
0.047
pqlc3
-0.011
taar19p
0.046
fstl1b
-0.011
LOC110438374
0.046
gapdh
-0.011
si:ch211-38m6.6
0.045
kctd12.2
-0.011
LOC110438215
0.044
emilin1b
-0.011
c8h22orf15
0.044
slc35d1a
-0.011
BX000981.12
0.044
zgc:113921
-0.011