Daniocell
si:dkeyp-4f2.3 (muscle)
si:dkeyp-4f2.3
ZFIN
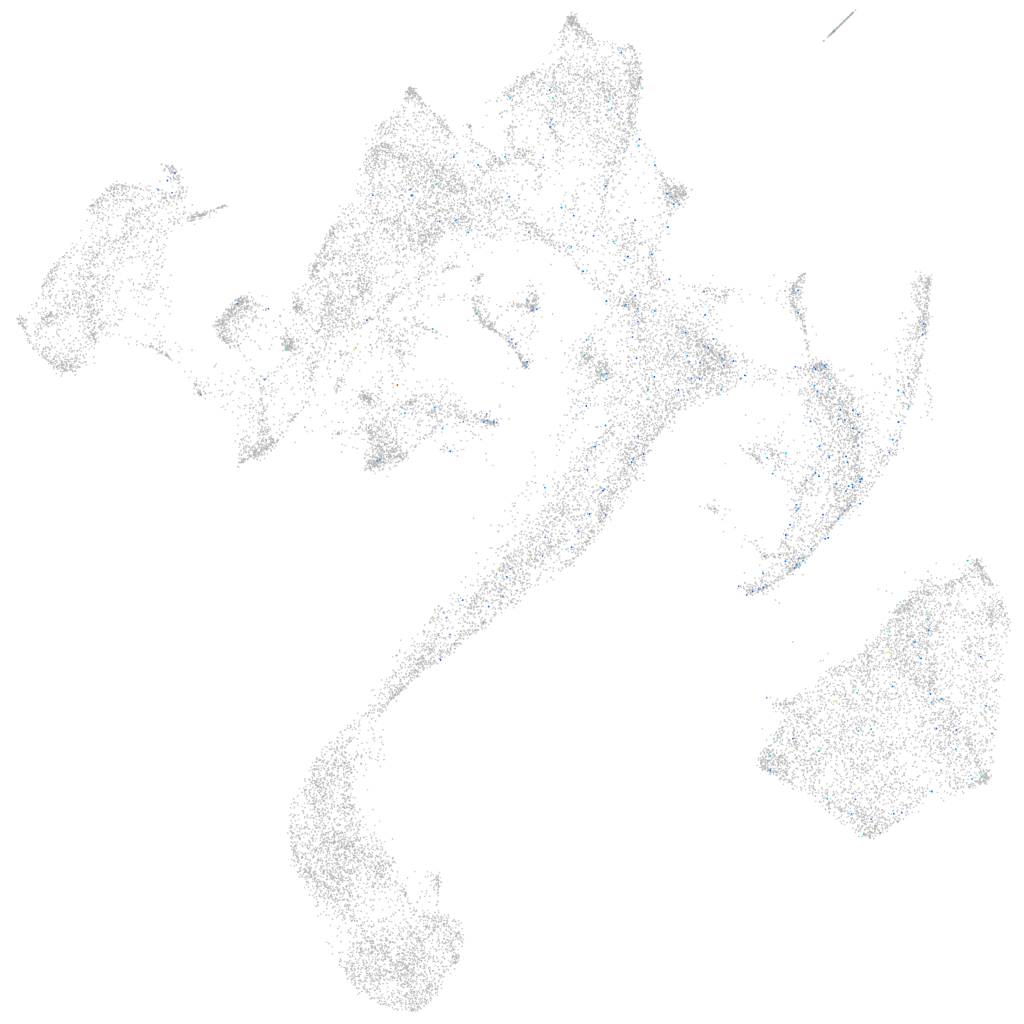
Gene expression UMAP
Display:
Expression
Stage
Other cell groups
all cells
blastomeres
PGCs
endoderm
axial mesoderm
muscle
mural cells /
non-skeletal muscle
mesenchyme
hematopoietic /
vasculature
pronephros
neural
spinal cord / glia
eye
taste / olfactory
otic / lateral line
epidermis
periderm
fin
ionocytes / mucous
pigment cells
Expression by stage/cluster
Correlated gene expression
Positive correlation
Negative correlation
Gene
r
Gene
r
si:ch211-244e12.7
0.091
actc1b
-0.046
si:ch211-15j1.5
0.091
pabpc4
-0.045
tmprss3b
0.083
ckmb
-0.043
LOC108184012
0.083
ckma
-0.043
gabra6a
0.082
pvalb1
-0.042
LOC110439867
0.073
neb
-0.042
XLOC-029654
0.073
ak1
-0.042
gcnt4b
0.068
nme2b.2
-0.041
CU929307.1
0.068
atp2a1
-0.041
LOC103909988
0.067
ldb3b
-0.040
hnf4a
0.065
si:ch73-367p23.2
-0.040
CU929146.1
0.064
pvalb2
-0.040
znf1027
0.064
actn3b
-0.040
LOC110439620
0.061
aldoab
-0.039
AL954694.1
0.060
tnnc2
-0.039
si:ch211-234p6.9
0.060
ttn.2
-0.039
LOC101883509
0.057
actn3a
-0.039
LOC103910873
0.056
smyd1a
-0.039
she
0.055
mylpfa
-0.039
wdr95
0.055
acta1b
-0.039
RF00319
0.055
gapdh
-0.038
CABZ01046425.1
0.053
XLOC-025819
-0.038
LO018011.1
0.052
mylz3
-0.038
pcdh2ab1
0.052
tnnt3b
-0.038
ran
0.052
pgam2
-0.038
si:dkeyp-92c9.4
0.052
si:dkey-16p21.8
-0.038
si:rp71-77l1.2
0.052
prx
-0.038
h2afvb
0.052
tnnt3a
-0.038
dnai2a
0.051
tmem38a
-0.038
BX569788.1
0.051
eno3
-0.038
cdc25d
0.051
myom1a
-0.037
khdrbs1a
0.050
tmod4
-0.037
lcat
0.050
hrc
-0.037
cdkn2aipnl
0.049
tnni2a.4
-0.037
ptpn23b
0.048
ank1a
-0.036