Daniocell
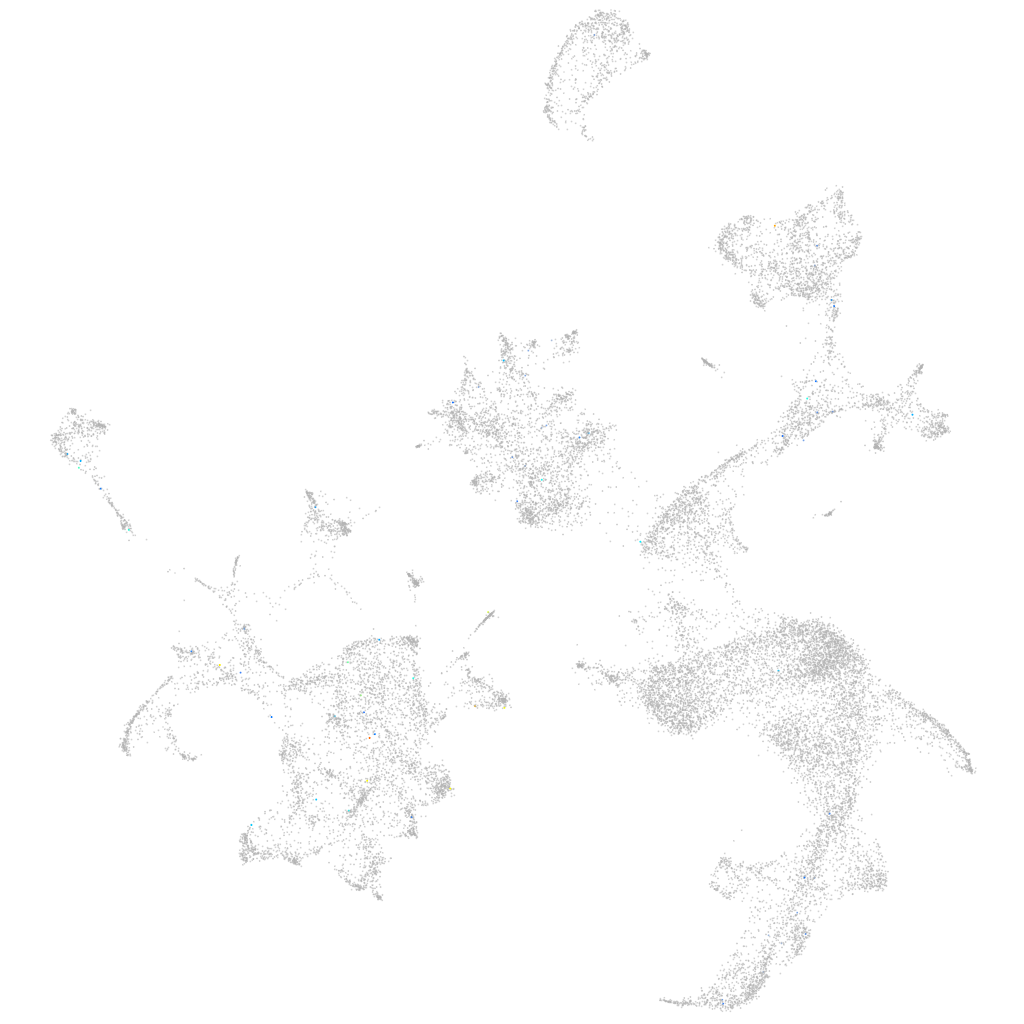
si:dkeyp-4f2.3 (hematopoietic / vasculature)
si:dkeyp-4f2.3
ZFIN
Gene expression UMAP
Display:
Expression
Stage
Other cell groups
all cells
blastomeres
PGCs
endoderm
axial mesoderm
muscle
mural cells /
non-skeletal muscle
mesenchyme
hematopoietic /
vasculature
pronephros
neural
spinal cord / glia
eye
taste / olfactory
otic / lateral line
epidermis
periderm
fin
ionocytes / mucous
pigment cells
Expression by stage/cluster
Correlated gene expression
Positive correlation
Negative correlation
Gene
r
Gene
r
XLOC-011926
0.306
hbbe2
-0.031
si:ch1073-228j22.2
0.222
prdx2
-0.031
si:ch211-120c15.3
0.203
hbbe1.3
-0.031
si:ch211-264e16.1
0.187
hbae3
-0.031
BX001030.2
0.178
fth1a
-0.031
si:ch73-368j24.3
0.152
hbae1.3
-0.030
slc25a47b
0.134
cahz
-0.028
LOC110440098
0.133
hbae1.1
-0.028
CR792417.1
0.131
gpx1a
-0.028
CR356227.1
0.129
hbbe1.1
-0.027
LOC108191042
0.127
blvrb
-0.026
LOC101885283
0.122
hemgn
-0.026
LOC103910313
0.121
creg1
-0.025
LOC101882926
0.121
alas2
-0.025
XLOC-009527
0.117
epb41b
-0.025
si:ch211-204d2.4
0.115
hbbe1.2
-0.025
si:dkeyp-5g9.1
0.108
si:ch211-250g4.3
-0.024
AL929192.1
0.107
si:ch211-207c6.2
-0.023
znf1051
0.093
nt5c2l1
-0.022
XLOC-007141
0.090
slc4a1a
-0.022
LOC101882617
0.085
tspo
-0.022
vwa2
0.084
nmt1b
-0.020
si:dkey-121j17.5
0.083
zgc:163057
-0.020
LOC103911747
0.078
ISCU (1 of many)
-0.020
LOC100537259
0.077
si:dkey-240n22.3
-0.019
adgrf7
0.074
hbae5
-0.019
LOC103910763.1
0.074
si:ch211-227m13.1
-0.019
LOC110438587
0.073
plac8l1
-0.019
LOC101882124
0.072
tmod4
-0.019
XLOC-043545
0.070
klf1
-0.018
clcn2a
0.068
pabpc1b
-0.018
BX247868.1
0.067
tfr1a
-0.018
ubap1la
0.067
TCIM (1 of many)
-0.018
BX539313.1
0.065
sptb
-0.017
zgc:173705
0.065
vdac2
-0.017