Daniocell
si:dkeyp-4f2.3 (blastomeres)
si:dkeyp-4f2.3
ZFIN
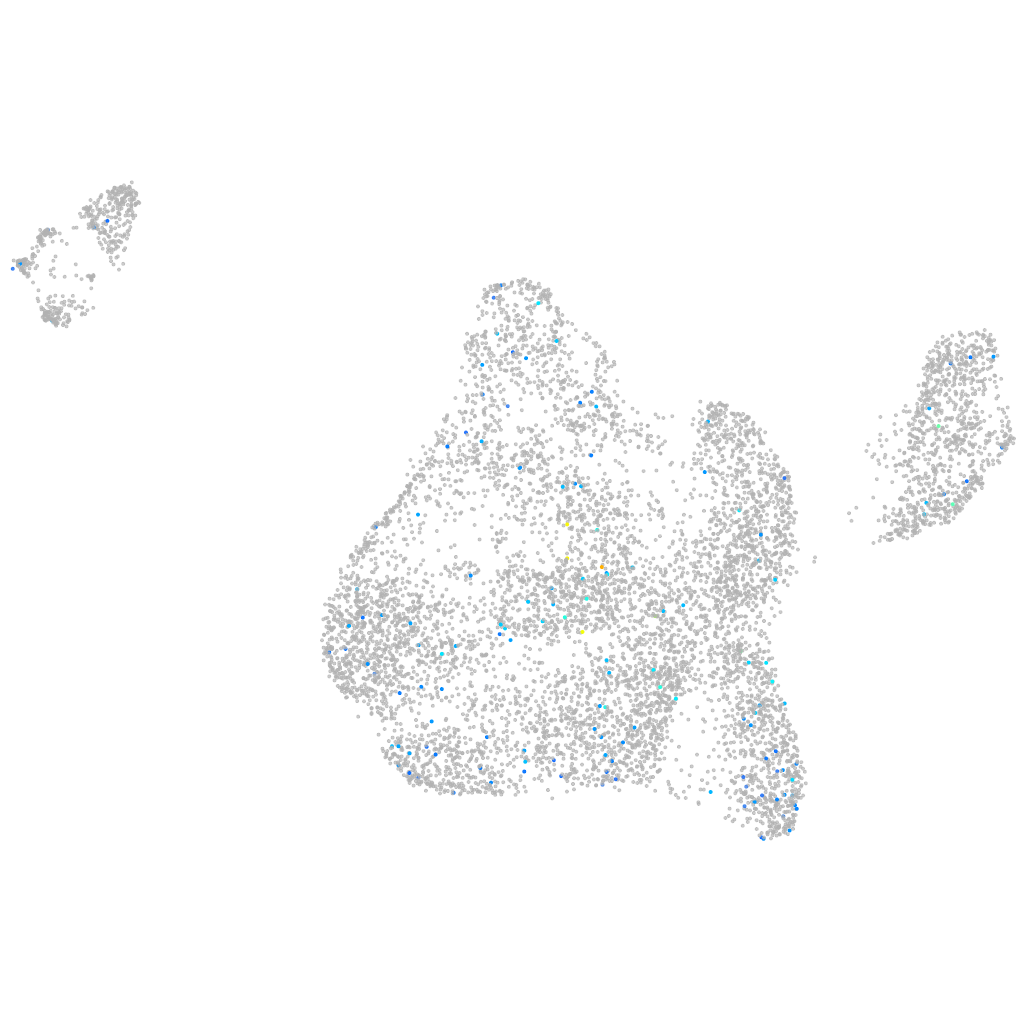
Gene expression UMAP
Display:
Expression
Stage
Other cell groups
all cells
blastomeres
PGCs
endoderm
axial mesoderm
muscle
mural cells /
non-skeletal muscle
mesenchyme
hematopoietic /
vasculature
pronephros
neural
spinal cord / glia
eye
taste / olfactory
otic / lateral line
epidermis
periderm
fin
ionocytes / mucous
pigment cells
Expression by stage/cluster
Correlated gene expression
Positive correlation
Negative correlation
Gene
r
Gene
r
or112-1
0.164
apopt1
-0.032
CR759846.1
0.141
rb1cc1
-0.032
kcnip3a
0.122
fdps
-0.030
zgc:103625
0.104
ppan
-0.030
si:dkey-4c15.12
0.097
xrn2
-0.029
si:ch73-266m14.1
0.097
wdhd1
-0.028
CABZ01075572.1
0.092
ier2b
-0.028
CR385067.1
0.091
pgrmc1
-0.028
plac8.1
0.091
fth1a
-0.028
BX470247.1
0.091
tmtc3
-0.028
wu:fc01d11
0.090
zgc:91910
-0.027
nrp2a
0.090
snapc5
-0.027
LOC108183658
0.089
abhd3
-0.027
si:ch211-175m2.4
0.088
rnf20
-0.027
otol1b
0.087
taf9
-0.026
CR383669.2
0.087
prkaa1
-0.026
LOC108192140
0.086
wdr48b
-0.026
si:ch211-149e23.4
0.085
noto
-0.026
tnnc2
0.085
eloal
-0.026
gpm6ba
0.085
zgc:113220
-0.026
lhfpl5a
0.084
kif20ba
-0.026
BX005397.1
0.083
wdr62
-0.025
bhlhe40
0.082
nup93
-0.025
adgrb2
0.082
srsf6a
-0.025
XLOC-015908
0.080
foxd3
-0.025
XLOC-002207
0.080
nus1
-0.025
lrguk
0.078
sptlc2a
-0.025
LOC103911318
0.076
tspan2a
-0.025
klhl33
0.075
znf217
-0.025
CU459093.1
0.075
prdx4
-0.025
rln
0.075
CABZ01092156.1
-0.025
si:dkeyp-87d8.8
0.075
ctsba
-0.025
hoxb5a
0.075
ube2h
-0.024
si:dkeyp-73a2.2
0.074
stk17b
-0.024
cskl
0.074
ctdspl3
-0.024