Daniocell
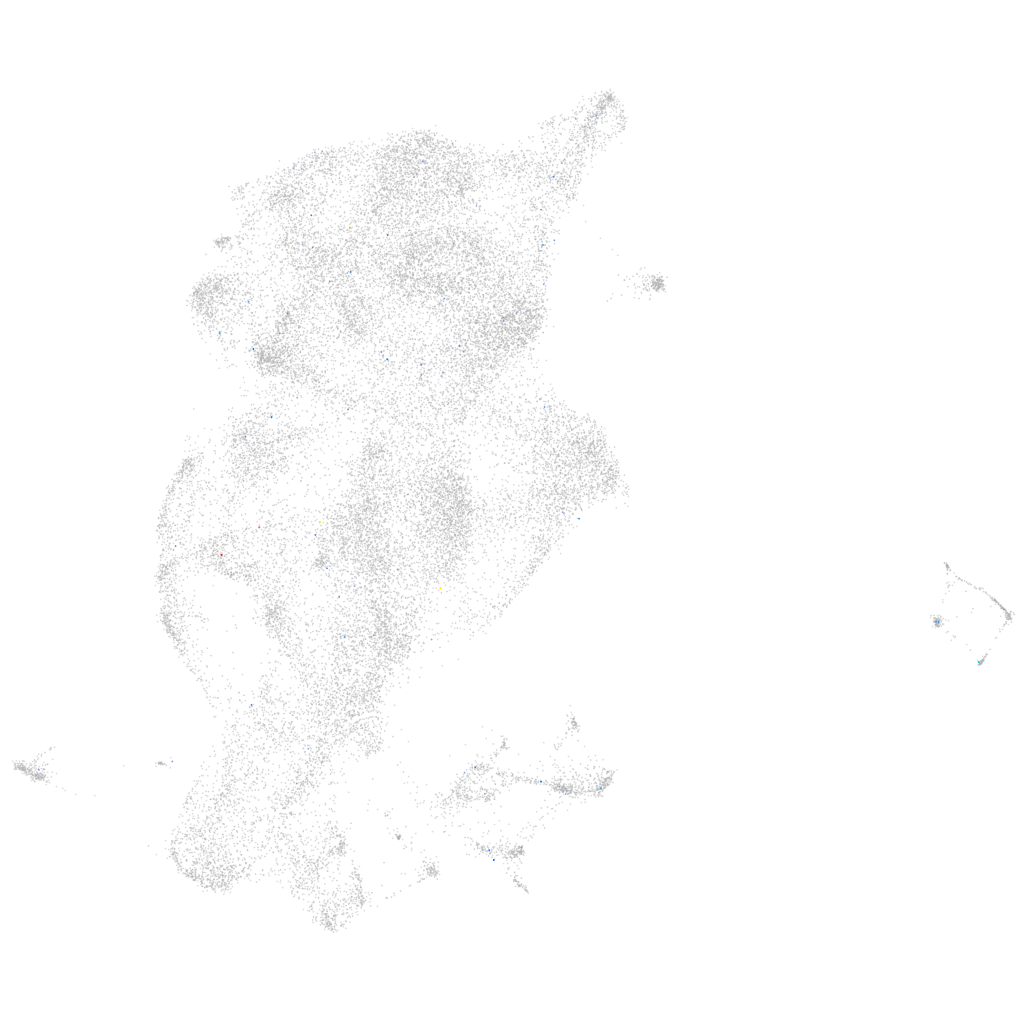
si:dkey-7i4.7 (periderm)
si:dkey-7i4.7
ZFIN
Gene expression UMAP
Display:
Expression
Stage
Other cell groups
all cells
blastomeres
PGCs
endoderm
axial mesoderm
muscle
mural cells /
non-skeletal muscle
mesenchyme
hematopoietic /
vasculature
pronephros
neural
spinal cord / glia
eye
taste / olfactory
otic / lateral line
epidermis
periderm
fin
ionocytes / mucous
pigment cells
Expression by stage/cluster
Correlated gene expression
Positive correlation
Negative correlation
Gene
r
Gene
r
ptgfrn
0.316
gsta.1
-0.024
sla1
0.278
rpl13a
-0.023
BX511079.1
0.155
si:dkey-222n6.2
-0.021
NC-002333.5
0.141
rpl24
-0.020
kcnk2b
0.135
rpl23
-0.020
ptafr
0.126
si:ch211-157c3.4
-0.019
rnf123
0.125
slc25a5
-0.018
trpc7b
0.123
rpl5a
-0.017
si:ch73-233f7.5
0.109
cfl1l
-0.017
BX908770.1
0.106
si:ch211-105c13.3
-0.017
XLOC-014770
0.105
rpl26
-0.016
zbtb20
0.104
rpl22
-0.016
adra2a
0.101
atp5mc3b
-0.016
XLOC-022888
0.098
cebpd
-0.016
si:dkey-156m2.3
0.097
anxa2a
-0.016
CR769769.2
0.095
rps10
-0.015
LOC100333235
0.094
phlda2
-0.015
LOC110438109
0.093
btg2
-0.015
aplnr2
0.093
pvalb1
-0.015
lingo3a
0.092
hbae3
-0.015
mtnr1aa
0.091
rps27a
-0.015
si:busm1-194e12.11
0.091
zgc:114188
-0.015
XLOC-027111
0.089
eef1db
-0.015
ephb4b
0.087
naprt
-0.015
lix1l
0.086
krt5
-0.014
rttn
0.086
myl12.1
-0.014
LOC110440075
0.085
fosab
-0.014
XLOC-019042
0.085
rps4x
-0.014
LOC110439426
0.084
si:ch73-204p21.2
-0.014
GNG4
0.084
fxyd6l
-0.014
rnf217
0.083
ckap4
-0.013
LOC108182916
0.081
capns1a
-0.013
si:rp71-45g20.11
0.081
eef1b2
-0.013
mfsd2aa
0.079
lye
-0.013
nacc2
0.078
tmem59
-0.013