Daniocell
si:dkey-7i4.7 (neural)
si:dkey-7i4.7
ZFIN
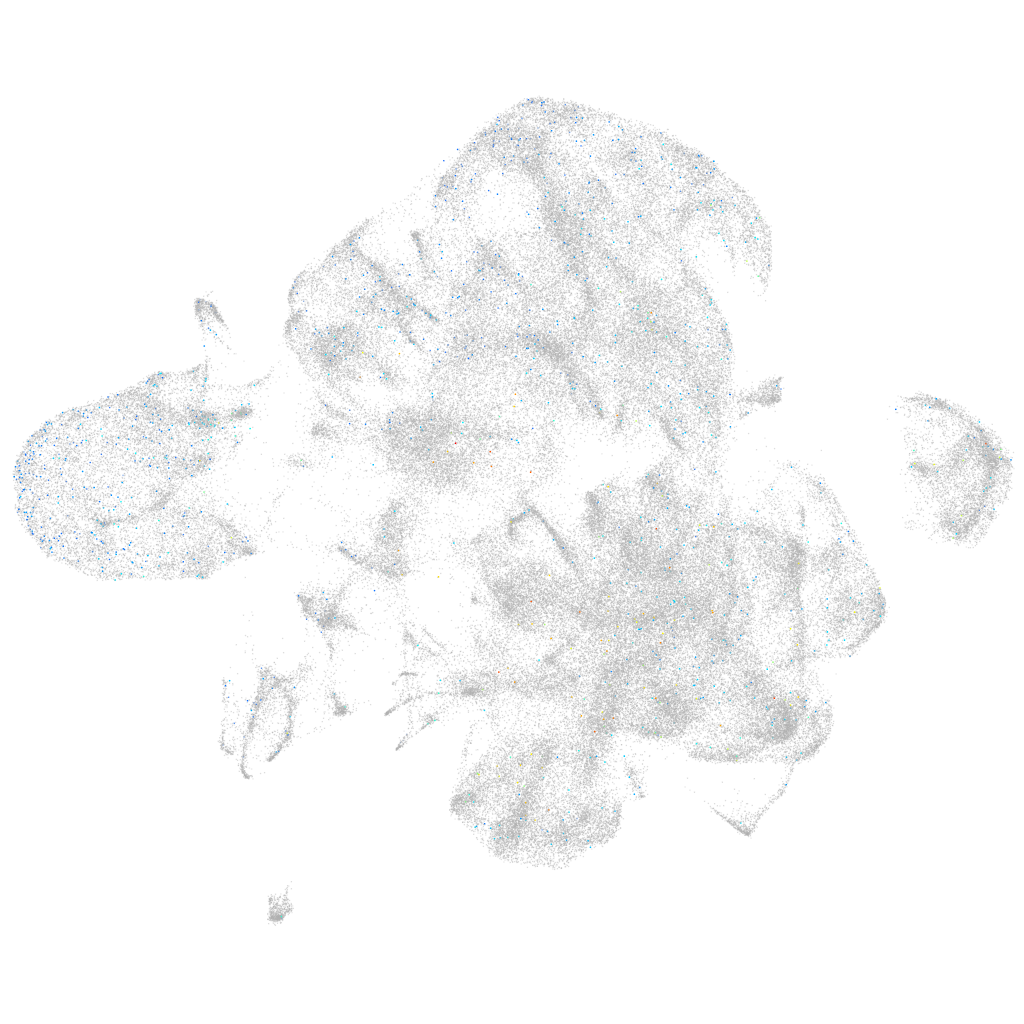
Gene expression UMAP
Display:
Expression
Stage
Other cell groups
all cells
blastomeres
PGCs
endoderm
axial mesoderm
muscle
mural cells /
non-skeletal muscle
mesenchyme
hematopoietic /
vasculature
pronephros
neural
spinal cord / glia
eye
taste / olfactory
otic / lateral line
epidermis
periderm
fin
ionocytes / mucous
pigment cells
Expression by stage/cluster
Correlated gene expression
Positive correlation
Negative correlation
Gene
r
Gene
r
LOC110439437
0.043
rps10
-0.027
LOC103910348
0.041
rpl37
-0.024
or133-1
0.041
zgc:114188
-0.022
CABZ01086139.1
0.036
h3f3a
-0.020
si:ch211-152c2.3
0.035
mt-nd1
-0.019
hspb1
0.035
ptmaa
-0.019
s100a1
0.034
ppiab
-0.019
si:dkey-243k1.3
0.034
pvalb2
-0.017
pou5f3
0.033
hbbe1.3
-0.017
si:dkey-279j5.1
0.033
zgc:158463
-0.017
stm
0.033
hnrnpa0l
-0.017
RF00392
0.032
actc1b
-0.017
XLOC-012390
0.032
mt-atp6
-0.016
si:dkey-157e10.8
0.030
rps17
-0.016
CR788249.1
0.030
COX3
-0.016
polr3gla
0.030
tuba1c
-0.016
COX7A2
0.030
hbae1.1
-0.016
si:ch211-71m22.5
0.029
slc32a1
-0.016
apoeb
0.029
marcksl1a
-0.015
asb11
0.029
hbae3
-0.015
aldob
0.028
cct2
-0.015
si:dkey-66i24.9
0.028
gapdhs
-0.014
zic2b
0.028
cyt1
-0.014
nop58
0.028
gng3
-0.014
si:ch1073-80i24.3
0.028
icn
-0.014
zmp:0000000624
0.028
rtn1b
-0.014
XLOC-000574
0.028
NC-002333.17
-0.013
si:dkey-92i17.2
0.028
nme2b.1
-0.013
anp32e
0.028
fabp3
-0.013
gnl3
0.028
tmsb4x
-0.013
nolc1
0.028
pvalb1
-0.013
nop2
0.028
rnasekb
-0.013
ing5b
0.028
rtn1a
-0.013
NC-002333.4
0.027
cyt1l
-0.013
gsg1l2a
0.027
stmn2a
-0.013