Daniocell
si:dkey-7i4.7 (eye)
si:dkey-7i4.7
ZFIN
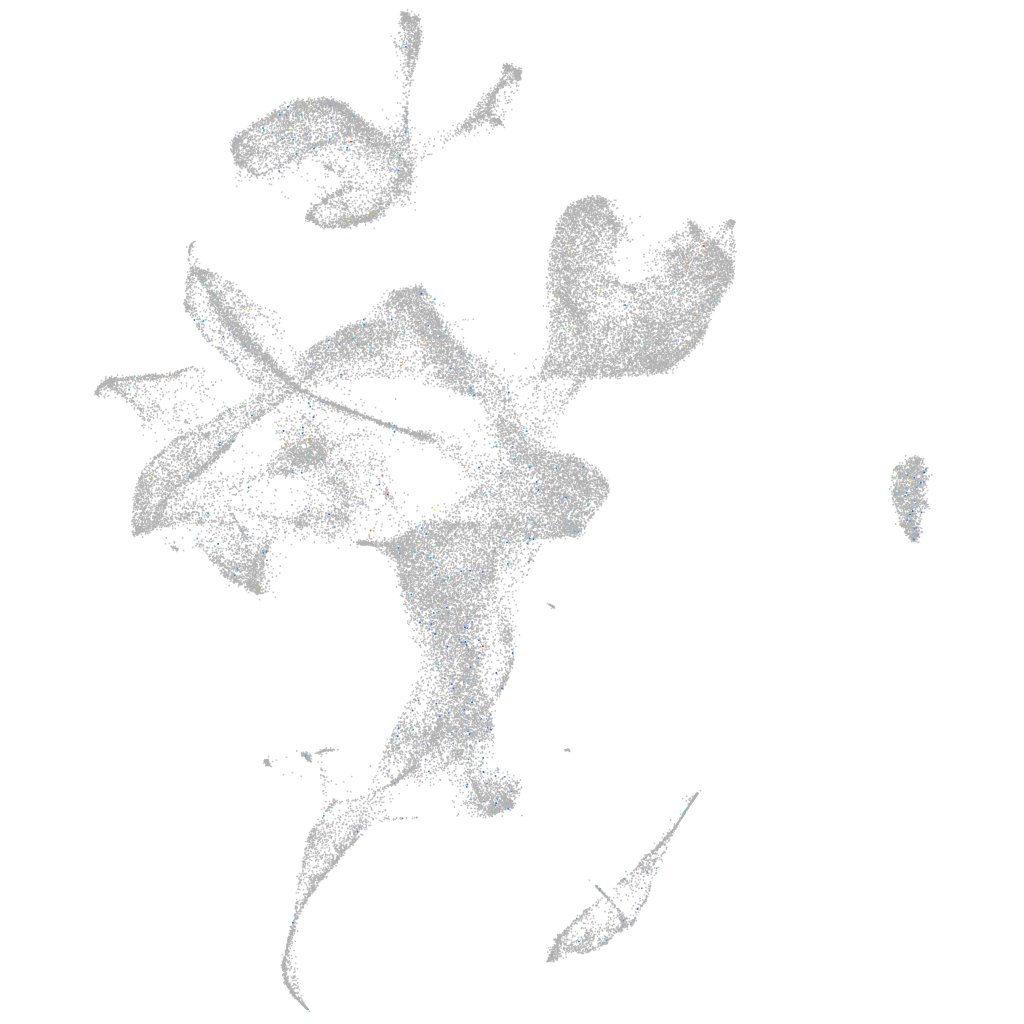
Gene expression UMAP
Display:
Expression
Stage
Other cell groups
all cells
blastomeres
PGCs
endoderm
axial mesoderm
muscle
mural cells /
non-skeletal muscle
mesenchyme
hematopoietic /
vasculature
pronephros
neural
spinal cord / glia
eye
taste / olfactory
otic / lateral line
epidermis
periderm
fin
ionocytes / mucous
pigment cells
Expression by stage/cluster
Correlated gene expression
Positive correlation
Negative correlation
Gene
r
Gene
r
LOC110440167
0.114
mt-atp6
-0.021
LOC108180774
0.095
npdc1a
-0.017
CR450687.1
0.085
mt-co2
-0.016
tgfb1b
0.079
tpi1b
-0.016
si:ch211-232d10.3
0.078
calm1a
-0.015
LOC108183555
0.076
atpv0e2
-0.015
dusp13a
0.074
syt5b
-0.015
LOC101883804
0.069
lrit1b
-0.015
XLOC-021835
0.060
tob1a
-0.015
si:dkey-22a18.2
0.060
bhlhe40
-0.015
si:ch211-152f2.2
0.055
tpma
-0.014
BX901889.5
0.054
krt4
-0.014
pcdh2ab3
0.053
atp1b2a
-0.014
si:ch211-106h4.4
0.052
rnasekb
-0.014
LOC100536609
0.049
cplx4a
-0.014
CU210919.1
0.048
atp5l
-0.014
cbln7
0.046
histh1l
-0.014
BX072554.2
0.046
pkma
-0.014
BX936397.1
0.046
sypb
-0.014
SERPINB8 (1 of many)
0.045
si:ch1073-83n3.2
-0.014
pla2r1
0.044
lrrtm1
-0.013
CU019662.1
0.043
actc1b
-0.013
BX120005.1
0.043
sh3gl2a
-0.013
XLOC-001318
0.043
mylz3
-0.013
BX248122.1
0.042
mt-nd1
-0.013
si:dkey-111i23.1
0.040
pvalb2
-0.013
CU074419.1
0.040
lactbl1b
-0.013
mir125b-3
0.038
gnb5b
-0.013
lrfn1
0.038
snap25b
-0.013
CABZ01079480.1
0.038
camk1db
-0.013
cilp2
0.038
atp5f1b
-0.013
znf1026
0.038
BX510923.1
-0.013
gpsm1b
0.038
si:ch211-56a11.2
-0.013
LOC100334054
0.037
gapdhs
-0.013
LOC103911995
0.037
sv2bb
-0.012