Daniocell
si:dkey-7i4.7 (hematopoietic / vasculature)
si:dkey-7i4.7
ZFIN
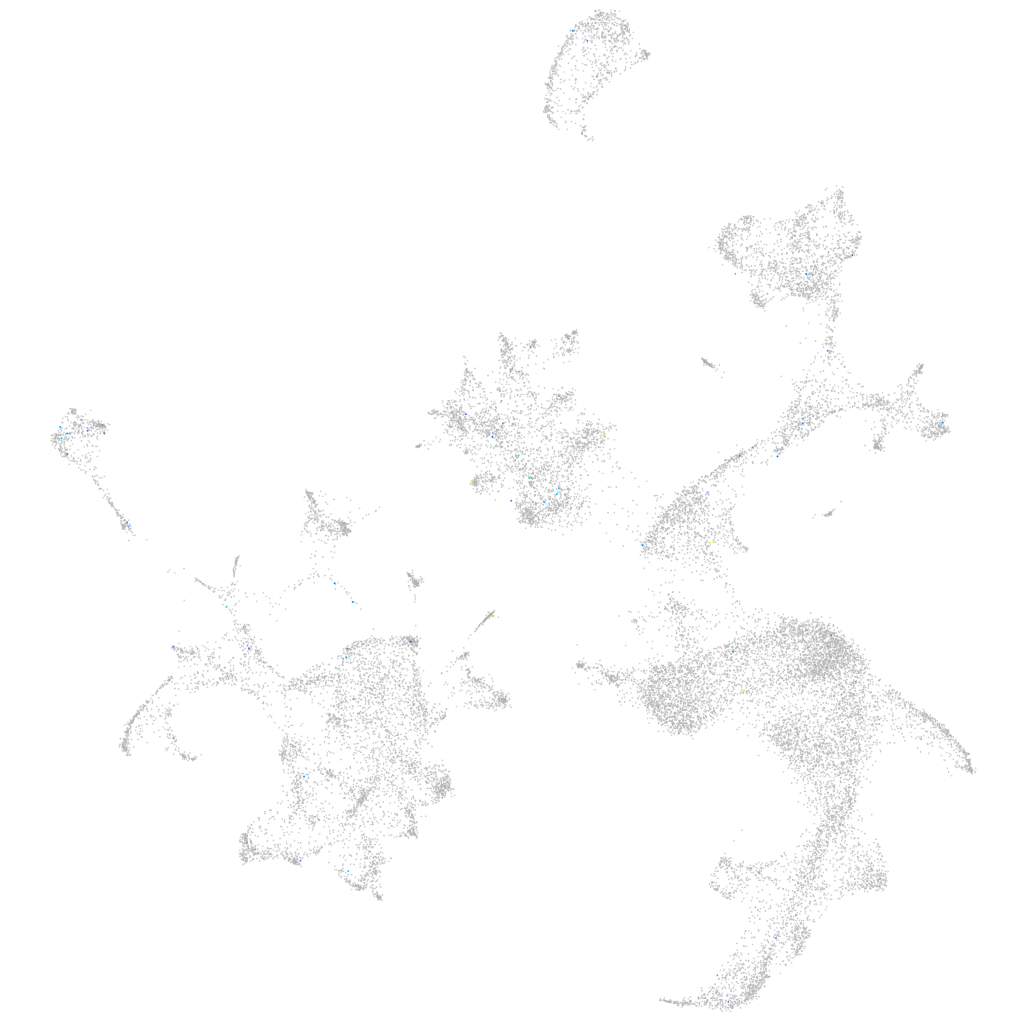
Gene expression UMAP
Display:
Expression
Stage
Other cell groups
all cells
blastomeres
PGCs
endoderm
axial mesoderm
muscle
mural cells /
non-skeletal muscle
mesenchyme
hematopoietic /
vasculature
pronephros
neural
spinal cord / glia
eye
taste / olfactory
otic / lateral line
epidermis
periderm
fin
ionocytes / mucous
pigment cells
Expression by stage/cluster
Correlated gene expression
Positive correlation
Negative correlation
Gene
r
Gene
r
neu3.5
0.195
zgc:163057
-0.023
BX323457.3
0.183
prdx2
-0.023
LOC108179300
0.137
cahz
-0.021
XLOC-020304
0.130
zgc:56095
-0.020
tacr3l
0.130
slc11a2
-0.019
slc7a8b
0.126
creg1
-0.019
slc6a19a.1
0.121
nt5c2l1
-0.018
BX908770.1
0.120
hemgn
-0.018
crygm2d14
0.105
tspo
-0.018
trim35-30
0.101
hbae3
-0.018
BX324212.1
0.100
hbae5
-0.018
zgc:175280
0.099
hbbe2
-0.018
C1orf232
0.098
alas2
-0.018
vwa10.2
0.097
slc4a1a
-0.018
tas2r202
0.097
sptb
-0.018
CABZ01068356.1
0.095
ucp3
-0.017
rnf212
0.090
hbae1.1
-0.017
LOC103911641
0.089
hbae1.3
-0.017
XLOC-007141
0.088
hbbe1.3
-0.017
si:ch211-157j23.3
0.086
nmt1b
-0.017
si:dkey-22h13.3
0.085
blvrb
-0.016
si:dkey-28o19.1
0.084
gpx1a
-0.016
pcdh1gb9
0.084
hbbe1.1
-0.016
drd4-rs
0.083
si:ch211-250g4.3
-0.016
CABZ01069436.1
0.082
nprl3
-0.015
LOC103909475
0.081
tfr1a
-0.015
fsip1
0.081
rhd
-0.015
XLOC-012505
0.081
si:dkey-240n22.3
-0.015
CU929359.1
0.080
icn2
-0.014
tdrd1
0.079
gp9
-0.014
XLOC-018776
0.079
mt2
-0.014
CABZ01081780.1
0.077
zgc:163080
-0.013
xkr7
0.076
ap2m1a
-0.013
CT025854.1
0.073
rhag
-0.013
ms4a17a.14
0.073
jak2a
-0.013