Daniocell
si:dkey-36i7.3 (pigment cells)
si:dkey-36i7.3
ZFIN
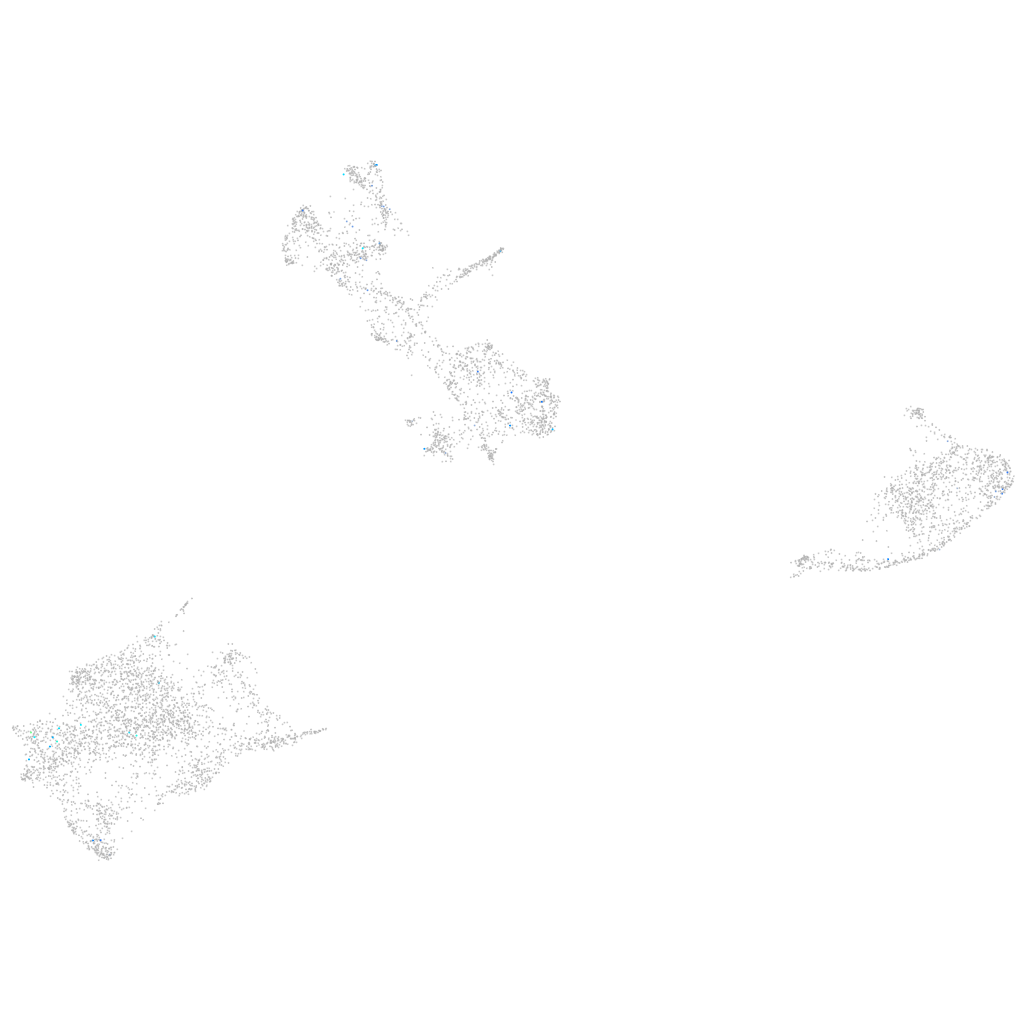
Gene expression UMAP
Display:
Expression
Stage
Other cell groups
all cells
blastomeres
PGCs
endoderm
axial mesoderm
muscle
mural cells /
non-skeletal muscle
mesenchyme
hematopoietic /
vasculature
pronephros
neural
spinal cord / glia
eye
taste / olfactory
otic / lateral line
epidermis
periderm
fin
ionocytes / mucous
pigment cells
Expression by stage/cluster
Correlated gene expression
Positive correlation
Negative correlation
Gene
r
Gene
r
zgc:163083
0.237
rps18
-0.043
LOC103910512
0.228
rps16
-0.037
CABZ01048453.1
0.199
rps29
-0.037
XLOC-002497
0.198
rack1
-0.036
LOC103910198
0.195
pcbd1
-0.036
XLOC-027129
0.187
syngr1a
-0.035
gig2p
0.182
sap30l
-0.034
si:ch211-120k19.1
0.180
arpc2
-0.032
LOC101884122
0.177
qdpra
-0.032
col28a1a
0.176
psma8
-0.032
si:ch211-106h4.4
0.174
fabp3
-0.031
BX005012.3
0.154
atp5mf
-0.030
dpep1
0.154
rab34b
-0.030
LOC100329806
0.154
ube2na
-0.030
si:dkey-58f10.12
0.154
psmc5
-0.030
LOC110439517
0.154
tspan10
-0.030
crybb1l3
0.152
psmb6
-0.030
chrna9
0.148
mpc1
-0.029
XLOC-037240
0.146
ssr2
-0.029
si:ch211-219a15.4
0.146
rbx1
-0.029
si:ch211-202m22.1
0.144
eif4bb
-0.029
urad
0.142
rab5if
-0.028
entpd8
0.139
ctbp1
-0.028
mbl2
0.138
bcap31
-0.028
klf12a
0.136
uri1
-0.028
XLOC-023228
0.127
slc2a11b
-0.028
si:ch211-135n15.2
0.127
sprb
-0.028
slc5a2
0.126
hnrnpaba
-0.028
ubr1
0.124
tmed10
-0.027
prkg2
0.124
srp54
-0.027
slc46a3
0.121
npm1a
-0.027
tmed6
0.119
rpl18a
-0.027
LOC110439519
0.118
tmem165
-0.027
CABZ01070631.1
0.117
alyref
-0.027
myhc4
0.113
ufc1
-0.027