Daniocell
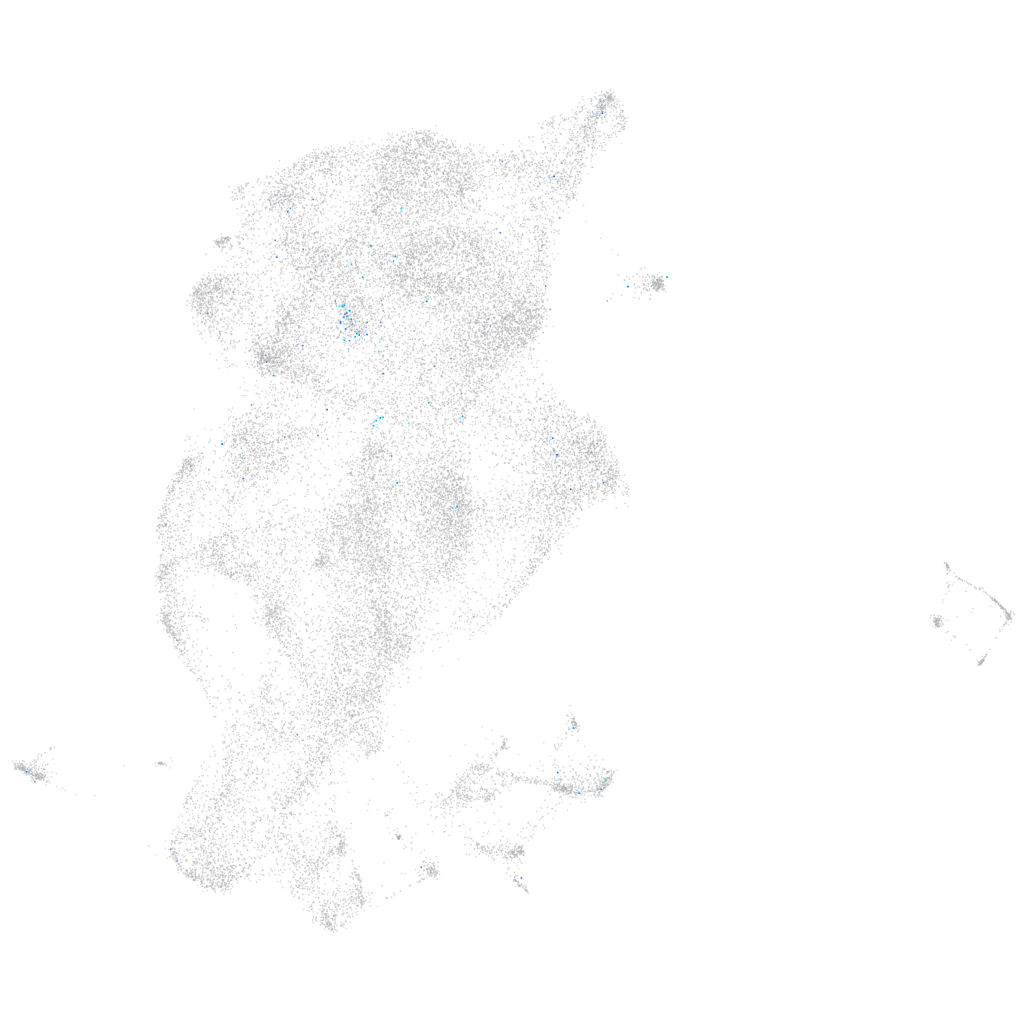
si:dkey-36i7.3 (periderm)
si:dkey-36i7.3
ZFIN
Gene expression UMAP
Display:
Expression
Stage
Other cell groups
all cells
blastomeres
PGCs
endoderm
axial mesoderm
muscle
mural cells /
non-skeletal muscle
mesenchyme
hematopoietic /
vasculature
pronephros
neural
spinal cord / glia
eye
taste / olfactory
otic / lateral line
epidermis
periderm
fin
ionocytes / mucous
pigment cells
Expression by stage/cluster
Correlated gene expression
Positive correlation
Negative correlation
Gene
r
Gene
r
CU929360.1
0.143
anxa1c
-0.044
XLOC-016003
0.137
krt4
-0.041
LOC101882968
0.134
cst14b.1
-0.040
mbl2
0.131
cyt1l
-0.039
si:ch211-139a5.9
0.126
cfl1l
-0.039
tmem54b
0.126
capns1a
-0.038
has3
0.123
gstp1
-0.038
crocc2
0.120
wu:fb18f06
-0.037
pcdh2ab12
0.118
zgc:174938
-0.036
XLOC-017021
0.118
zgc:193505
-0.036
LOC108179161
0.113
agr1
-0.035
lgals2b
0.112
zgc:153284
-0.035
AL590145.1
0.109
capn9
-0.035
si:ch211-133l5.7
0.107
ywhaz
-0.033
fgf11b
0.106
serf2
-0.033
abcc12
0.098
osgn1
-0.032
CABZ01056629.1
0.097
myl12.1
-0.031
si:rp71-39b20.4
0.097
abracl
-0.031
tmem121aa
0.097
adh8b
-0.031
tnni4a
0.096
si:ch211-195b11.3
-0.031
XLOC-043372
0.096
ANXA1 (1 of many)
-0.030
CABZ01050944.1
0.095
ywhabl
-0.030
crtac1b
0.094
si:ch73-281n10.2
-0.029
CACNA2D3 (1 of many)
0.092
cyt1
-0.029
tnnc1a
0.091
zgc:175088
-0.029
apoa2
0.090
cxcl14
-0.029
LOC100005908
0.089
hmga1a
-0.028
BX005054.1
0.089
cbr1l
-0.028
si:dkey-90l8.3
0.088
tspo
-0.028
igsf21a
0.087
capgb
-0.028
myh7l
0.086
sri
-0.028
nkx2.5
0.085
alox12
-0.028
wu:fk65c09
0.085
gmppb
-0.028
prlra
0.084
gale
-0.027
malb
0.084
ostc
-0.027