Daniocell
si:dkey-36i7.3 (fin)
si:dkey-36i7.3
ZFIN
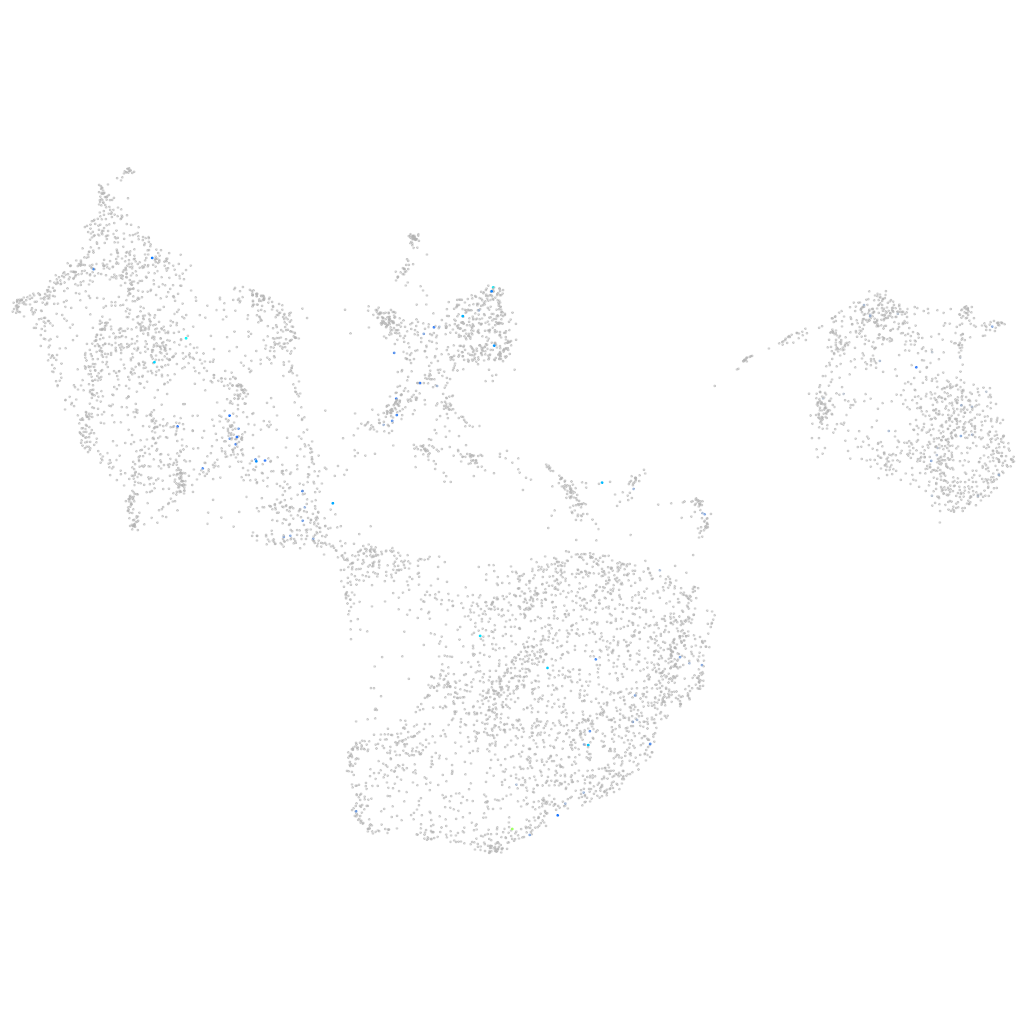
Gene expression UMAP
Display:
Expression
Stage
Other cell groups
all cells
blastomeres
PGCs
endoderm
axial mesoderm
muscle
mural cells /
non-skeletal muscle
mesenchyme
hematopoietic /
vasculature
pronephros
neural
spinal cord / glia
eye
taste / olfactory
otic / lateral line
epidermis
periderm
fin
ionocytes / mucous
pigment cells
Expression by stage/cluster
Correlated gene expression
Positive correlation
Negative correlation
Gene
r
Gene
r
bfsp2
0.313
ppib
-0.061
LOC101884541
0.275
ppt1
-0.043
XLOC-023624
0.273
dnase1l4.1
-0.043
LOC110439948
0.262
sparc
-0.042
si:dkey-223p19.2
0.257
hdlbpa
-0.042
XLOC-035196
0.211
capn12
-0.041
LOC101882784
0.190
itgav
-0.041
LOC101884382
0.190
myh9a
-0.041
BX649484.1
0.180
col2a1b
-0.039
si:ch73-122g19.1
0.180
si:dkey-102c8.3
-0.038
slc51a
0.172
zgc:153284
-0.037
CR759841.1
0.170
ckap4
-0.037
LOC110438399
0.169
col1a1b
-0.037
htr1fa
0.167
krt4
-0.037
eps8l3b
0.162
arhgdig
-0.036
rundc3aa
0.161
pleca
-0.036
tmc6a
0.161
wu:fb55g09
-0.036
LOC103910869
0.160
lima1a
-0.036
slc20a1a
0.159
ptbp1a
-0.035
si:ch211-139a5.9
0.159
arpc3
-0.035
slc16a5b
0.158
postnb
-0.035
XLOC-037213
0.153
chac1
-0.035
bsnd
0.147
cst14a.2
-0.035
rom1b
0.146
GCA
-0.035
FO704819.1
0.145
arpc4l
-0.035
rps6ka2
0.142
pkp3a
-0.035
drd3
0.138
gadd45ba
-0.035
mxg
0.138
p3h1
-0.034
pdzd7a
0.137
st14a
-0.034
si:dkey-61n16.5
0.136
p4ha2
-0.034
ccdc39
0.135
s100a10b
-0.034
LOC101886196
0.135
zgc:101810
-0.034
XLOC-023228
0.131
col4a5
-0.034
il1rl1
0.130
sept7a
-0.033
foxb2
0.129
matn4
-0.033