Daniocell
si:dkey-12e7.4 (muscle)
si:dkey-12e7.4
ZFIN
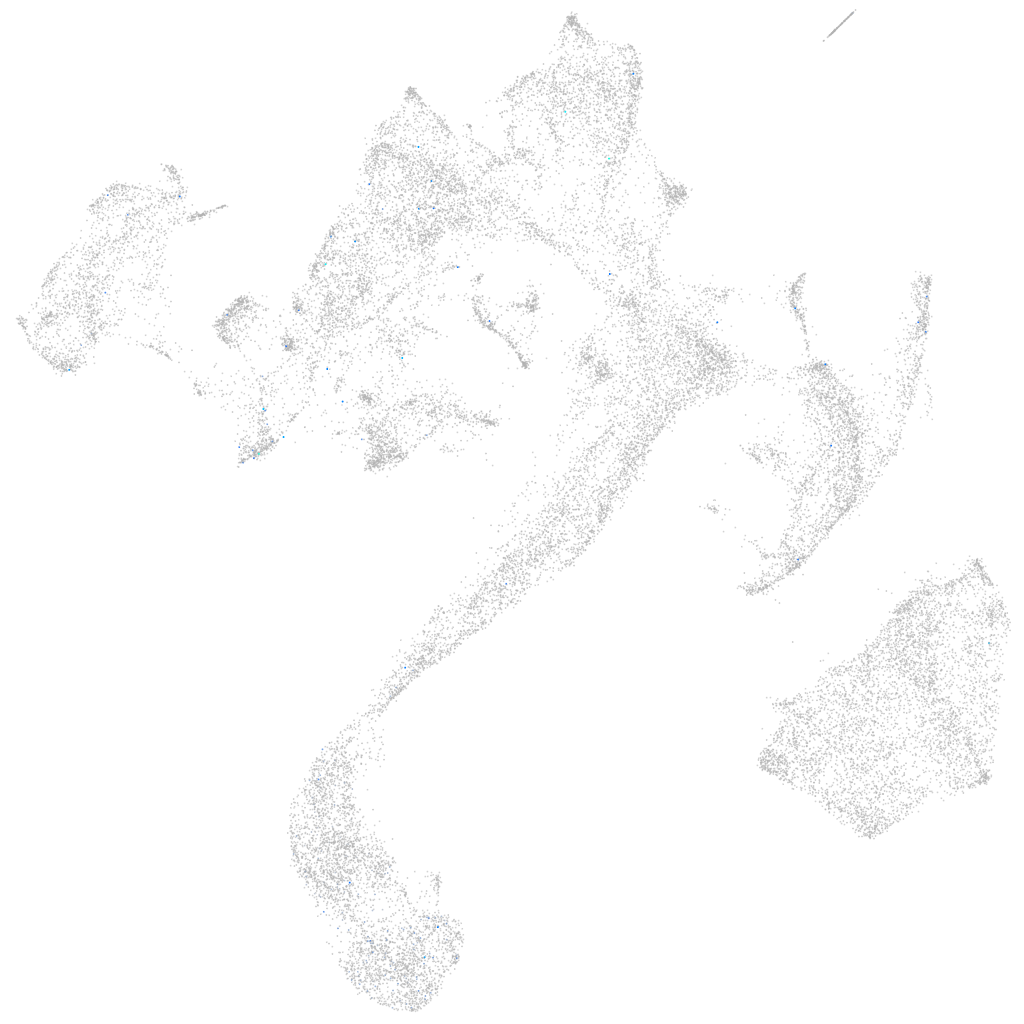
Gene expression UMAP
Display:
Expression
Stage
Other cell groups
all cells
blastomeres
PGCs
endoderm
axial mesoderm
muscle
mural cells /
non-skeletal muscle
mesenchyme
hematopoietic /
vasculature
pronephros
neural
spinal cord / glia
eye
taste / olfactory
otic / lateral line
epidermis
periderm
fin
ionocytes / mucous
pigment cells
Expression by stage/cluster
Correlated gene expression
Positive correlation
Negative correlation
Gene
r
Gene
r
si:cabz01069015.1
0.164
hmgn6
-0.054
si:ch211-266a5.12
0.149
hsp90ab1
-0.053
CR556712.1
0.125
h3f3d
-0.052
oscp1b
0.113
pabpc1a
-0.052
CR382337.2
0.104
cirbpb
-0.052
si:dkeyp-97a10.3
0.100
hnrnpaba
-0.051
LOC100536761
0.098
si:ch73-1a9.3
-0.051
XLOC-013149
0.097
naca
-0.050
si:ch211-14a11.1
0.095
khdrbs1a
-0.050
BX248331.2
0.094
syncrip
-0.050
LOC555793
0.092
hmga1a
-0.050
LOC101883594
0.090
rbm8a
-0.050
prlh
0.089
ubc
-0.049
otol1a
0.087
h2afvb
-0.049
si:ch211-203k16.3
0.085
ran
-0.048
BX511034.6
0.085
setb
-0.046
fgf9
0.083
eef1a1l1
-0.046
otogl
0.081
npm1a
-0.046
si:dkey-165n16.5
0.080
hnrnpa0b
-0.046
si:dkey-13n23.3.1
0.080
hmgb2b
-0.046
LOC101886687
0.080
nop56
-0.045
ncf2
0.079
hmgn2
-0.045
gprc5c
0.079
nucks1a
-0.045
cabp4
0.076
cirbpa
-0.045
CU207275.1
0.075
si:ch211-222l21.1
-0.045
wdr47a
0.074
ncl
-0.045
BX537305.1
0.074
hmgb2a
-0.044
mkrn2os.2
0.074
snu13b
-0.044
CR385053.1
0.074
cbx3a
-0.044
otol1b
0.074
srsf5a
-0.044
LOC108191602
0.073
hnrnpabb
-0.043
tecta
0.071
snrpb
-0.043
rom1a
0.069
ptmab
-0.043
tnnt3b
0.067
snrpg
-0.042
si:ch211-133n4.6
0.067
snrpf
-0.042