Daniocell
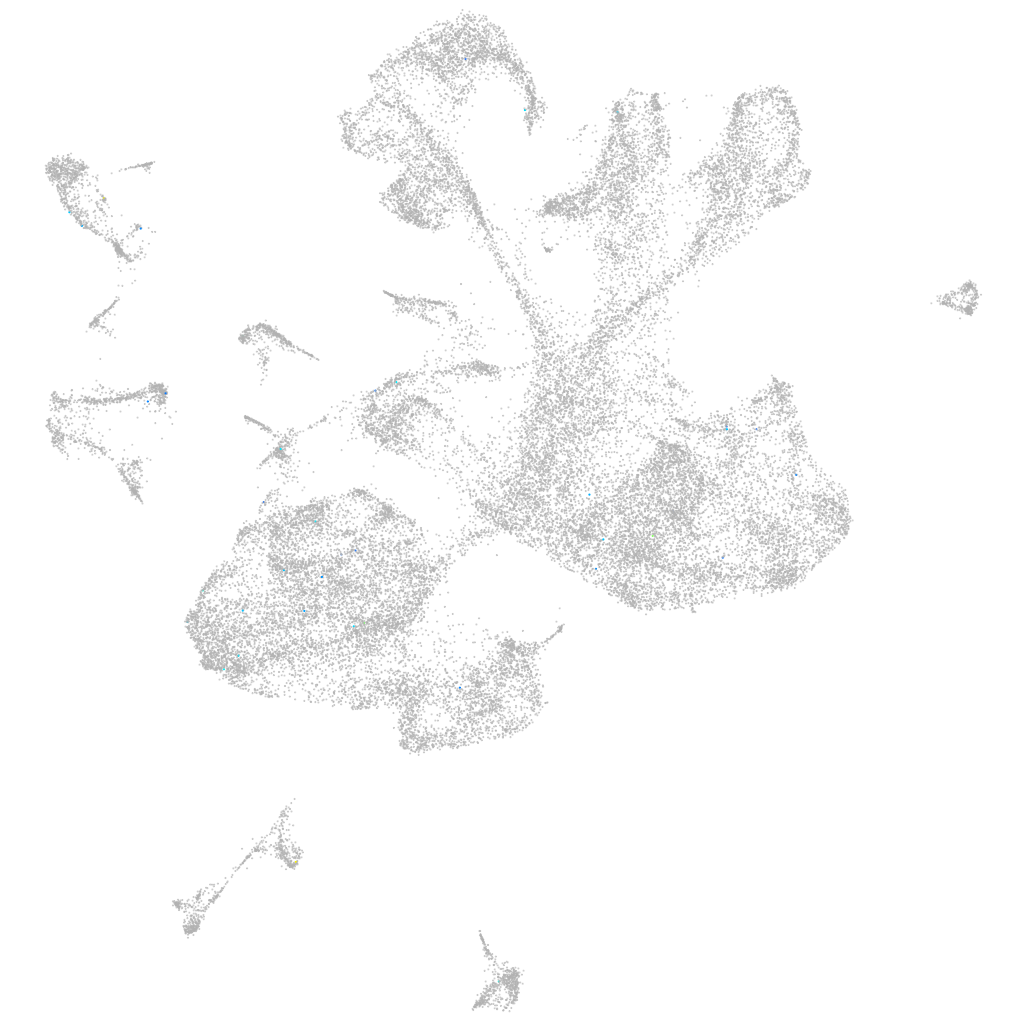
si:dkey-12e7.4 (glial cells / spinal cord)
si:dkey-12e7.4
ZFIN
Gene expression UMAP
Display:
Expression
Stage
Other cell groups
all cells
blastomeres
PGCs
endoderm
axial mesoderm
muscle
mural cells /
non-skeletal muscle
mesenchyme
hematopoietic /
vasculature
pronephros
neural
spinal cord / glia
eye
taste / olfactory
otic / lateral line
epidermis
periderm
fin
ionocytes / mucous
pigment cells
Expression by stage/cluster
Correlated gene expression
Positive correlation
Negative correlation
Gene
r
Gene
r
CABZ01061501.1
0.149
elavl3
-0.020
spink2.4
0.139
srsf9
-0.016
mpeg1.2
0.120
sox11b
-0.016
mir92a-1
0.117
acvr2ba
-0.016
si:dkeyp-101e12.1
0.114
ptmab
-0.016
tpo
0.111
h3f3d
-0.016
zmp:0000001074
0.110
hoxb9a
-0.016
ugt2b3
0.107
si:ch211-222l21.1
-0.016
LOC101882926
0.097
hmgn6
-0.016
LOC108180164
0.096
hdac1
-0.015
LOC108179963
0.078
erh
-0.015
sox17
0.077
nkain1
-0.014
si:ch211-222n4.2
0.076
chd7
-0.014
si:dkeyp-4c4.2
0.072
baz2ba
-0.014
si:ch73-18b11.2
0.072
fam133b
-0.014
grk5
0.072
sf3b5
-0.014
si:ch211-258f1.3
0.071
hnrnph1l
-0.014
CU896541.1
0.070
khdrbs1a
-0.014
XLOC-027892
0.069
arglu1a
-0.014
BX530034.1
0.068
chd4a
-0.013
or106-7
0.067
dla
-0.013
XLOC-011066
0.059
hmg20a
-0.013
si:ch73-91k6.1
0.059
hoxa9a
-0.013
NC-002333.5
0.058
hnrnpa0a
-0.013
or109-11
0.055
zgc:100920
-0.013
wnt5a
0.055
dld
-0.013
BX901957.1
0.054
rtn1a
-0.013
CT030144.1
0.054
h2afvb
-0.013
zgc:171927
0.053
sox11a
-0.012
CABZ01081535.1
0.053
XLOC-003692
-0.012
grn1
0.051
scrt2
-0.012
gsg1l2a
0.051
hoxb8a
-0.012
BX571794.2
0.050
ube2e1
-0.012
si:dkey-228d14.5
0.050
dlb
-0.012
si:dkey-29j8.1
0.050
mapk12b
-0.012