Daniocell
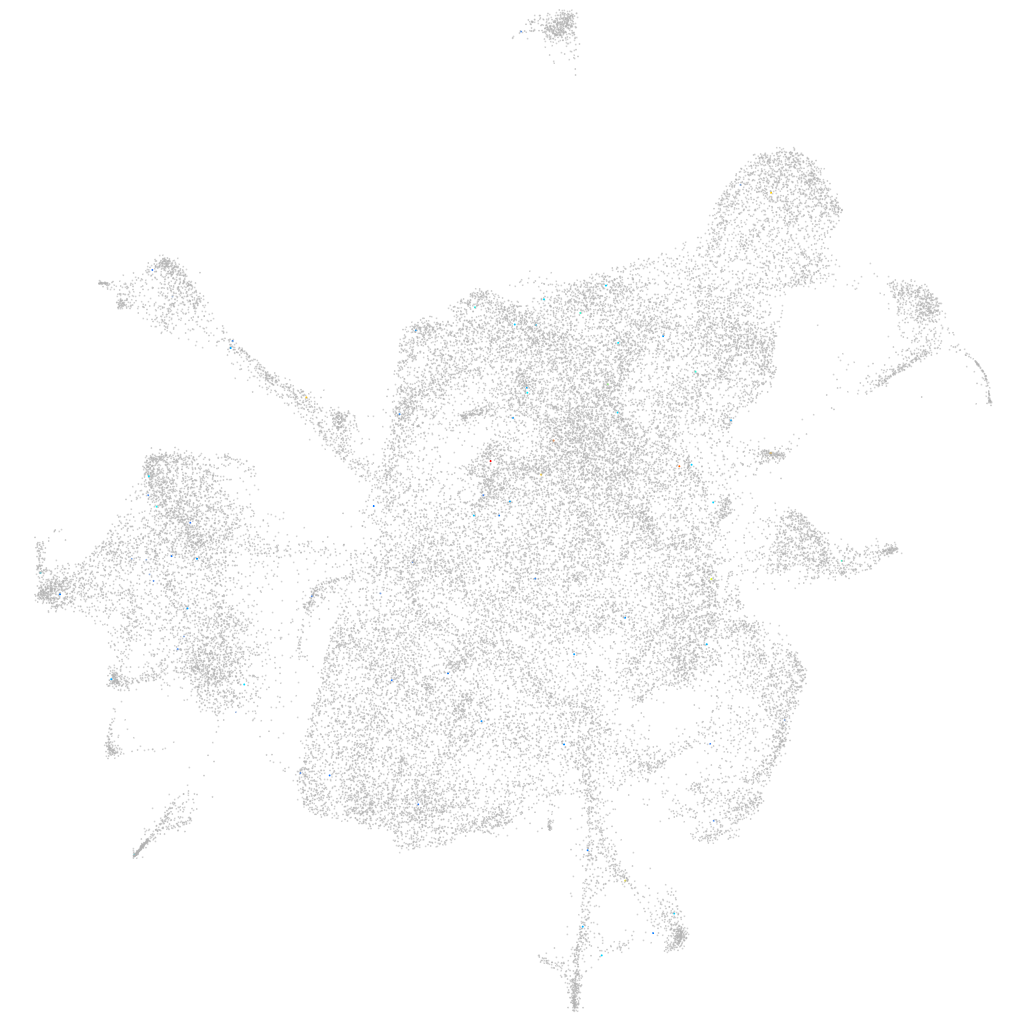
si:dkey-12e7.4 (mesenchyme)
si:dkey-12e7.4
ZFIN
Gene expression UMAP
Display:
Expression
Stage
Other cell groups
all cells
blastomeres
PGCs
endoderm
axial mesoderm
muscle
mural cells /
non-skeletal muscle
mesenchyme
hematopoietic /
vasculature
pronephros
neural
spinal cord / glia
eye
taste / olfactory
otic / lateral line
epidermis
periderm
fin
ionocytes / mucous
pigment cells
Expression by stage/cluster
Correlated gene expression
Positive correlation
Negative correlation
Gene
r
Gene
r
ftr60
0.162
fkbp1aa
-0.013
BX545917.3
0.143
asph
-0.013
ftr66
0.141
ptmab
-0.013
si:ch211-198o12.4
0.119
cfl1
-0.012
LOC108191543
0.113
ube2v2
-0.012
LOC100332639
0.100
cap1
-0.012
si:dkey-31m5.2
0.095
slit3
-0.011
BX004770.1
0.092
ncor2
-0.011
LOC103909867
0.091
pik3r2
-0.011
LOC110440019
0.082
smad2
-0.011
LO018550.2
0.081
tomm70a
-0.011
CR954285.1
0.078
zgc:91910
-0.011
fut8b
0.074
si:ch211-222l21.1
-0.011
parp11
0.072
atp5l
-0.011
LOC101886161
0.072
ywhaqb
-0.010
znfl1h
0.068
si:ch73-281n10.2
-0.010
si:cabz01033205.3
0.065
cmpk
-0.010
si:ch211-196f2.6
0.063
psmd1
-0.010
otofb
0.063
lmnb1
-0.010
si:dkey-77f5.6
0.060
ankrd12
-0.010
LOC103911601
0.059
si:ch211-11k18.4
-0.010
igfbp5a
0.059
hmga1a
-0.010
nipal4
0.057
hnrnpa0b
-0.010
efemp1
0.055
ctbp1
-0.010
gla
0.052
hmgn2
-0.010
bdkrb1
0.052
nog1
-0.010
si:dkey-151j17.4
0.049
smc3
-0.010
BX322665.3
0.048
chac1
-0.010
adamts16
0.047
ss18l2
-0.010
CABZ01041495.1
0.045
sp3a
-0.009
march1
0.044
cox7c
-0.009
pimr85
0.044
si:ch73-1a9.3
-0.009
si:dkey-188i13.10
0.044
tcea1
-0.009
si:ch211-152c8.2
0.043
dlgap5
-0.009
si:ch211-246b8.5
0.042
arpc4l
-0.009