Daniocell
si:dkey-12e7.4 (mural cells / non-skeletal muscle)
si:dkey-12e7.4
ZFIN
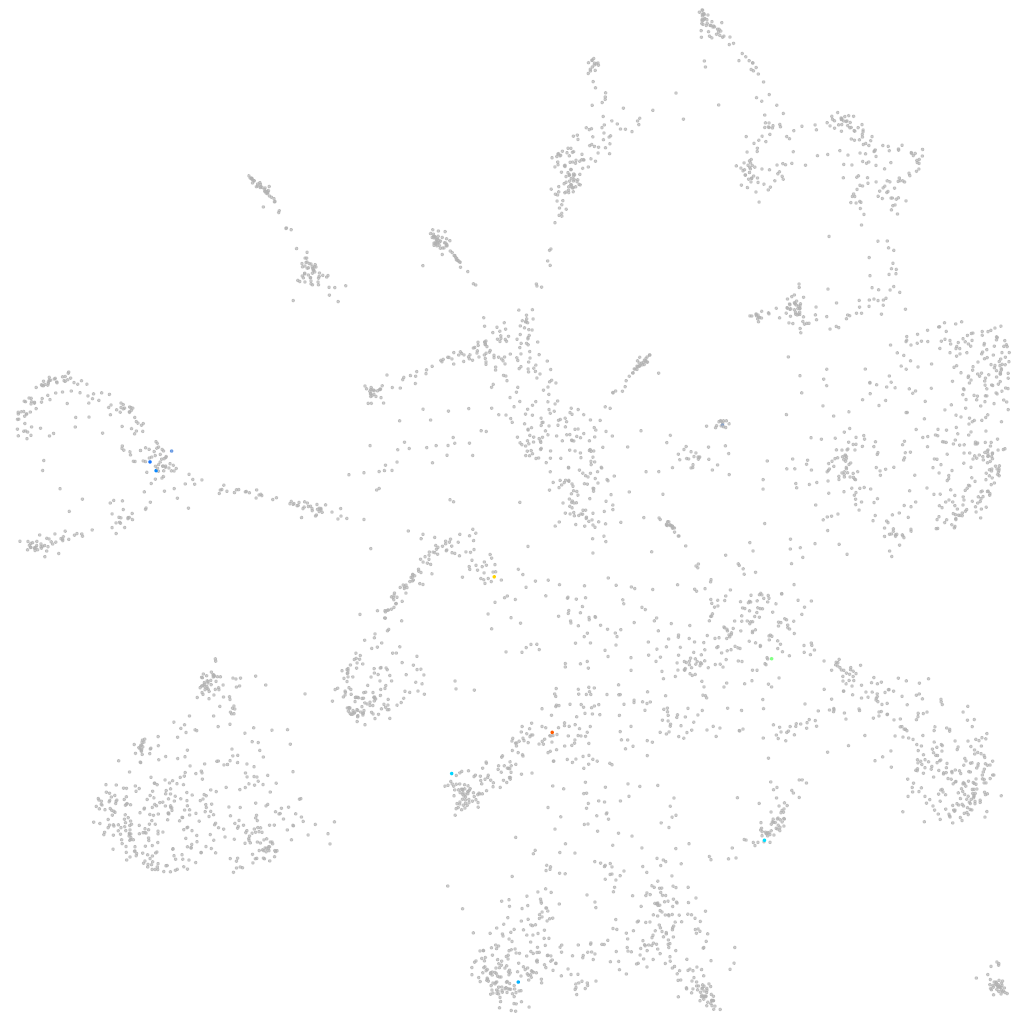
Gene expression UMAP
Display:
Expression
Stage
Other cell groups
all cells
blastomeres
PGCs
endoderm
axial mesoderm
muscle
mural cells /
non-skeletal muscle
mesenchyme
hematopoietic /
vasculature
pronephros
neural
spinal cord / glia
eye
taste / olfactory
otic / lateral line
epidermis
periderm
fin
ionocytes / mucous
pigment cells
Expression by stage/cluster
Correlated gene expression
Positive correlation
Negative correlation
Gene
r
Gene
r
si:dkeyp-34f6.4
0.551
rps9
-0.056
grhl3
0.379
hspa8
-0.042
AL954831.1
0.340
si:dkey-261h17.1
-0.039
TULP1
0.319
eef2b
-0.038
si:ch73-139e5.4
0.286
flot2a
-0.035
LOC100333163
0.277
rbx1
-0.032
gpa33a
0.277
si:ch73-46j18.5
-0.032
si:ch73-132k15.2
0.274
si:ch73-1a9.3
-0.032
CU929144.1
0.266
h2afvb
-0.032
derl3
0.258
mt-nd3
-0.030
si:dkey-14d8.6
0.242
NDUFB1
-0.029
BX511034.5
0.221
fbn2b
-0.029
zgc:153031
0.219
anp32b
-0.029
lrig3.1
0.210
tmsb4x
-0.029
BX649328.1
0.207
sumo2b
-0.028
fut10
0.202
ccni
-0.028
si:cabz01054394.6
0.198
pnrc2
-0.028
htr1d
0.192
fthl27
-0.027
gba2
0.190
tmem88b
-0.027
CU651668.1
0.182
eif4a3
-0.027
zgc:158376
0.182
rhag
-0.027
cpa6
0.178
akap12b
-0.027
taar19c
0.173
krt94
-0.027
LOC110439849
0.169
CABZ01080702.1
-0.026
si:dkey-9i23.4
0.168
atp5pf
-0.026
KCNIP1
0.164
atp5mc3a
-0.026
si:cabz01036022.1
0.163
mt-co1
-0.026
zgc:123238
0.163
fosb
-0.026
aldh4a1
0.162
ctsla
-0.026
fam13a
0.162
cirbpb
-0.026
slc22a16
0.160
cox6c
-0.026
LOC103911445
0.160
eif3c
-0.026
CABZ01068366.1
0.158
cops9
-0.026
zgc:194578
0.156
glulb
-0.025
igflr1
0.156
NC-002333.17
-0.025