Daniocell
si:ch73-15b2.5 (hematopoietic / vasculature)
si:ch73-15b2.5
ZFIN
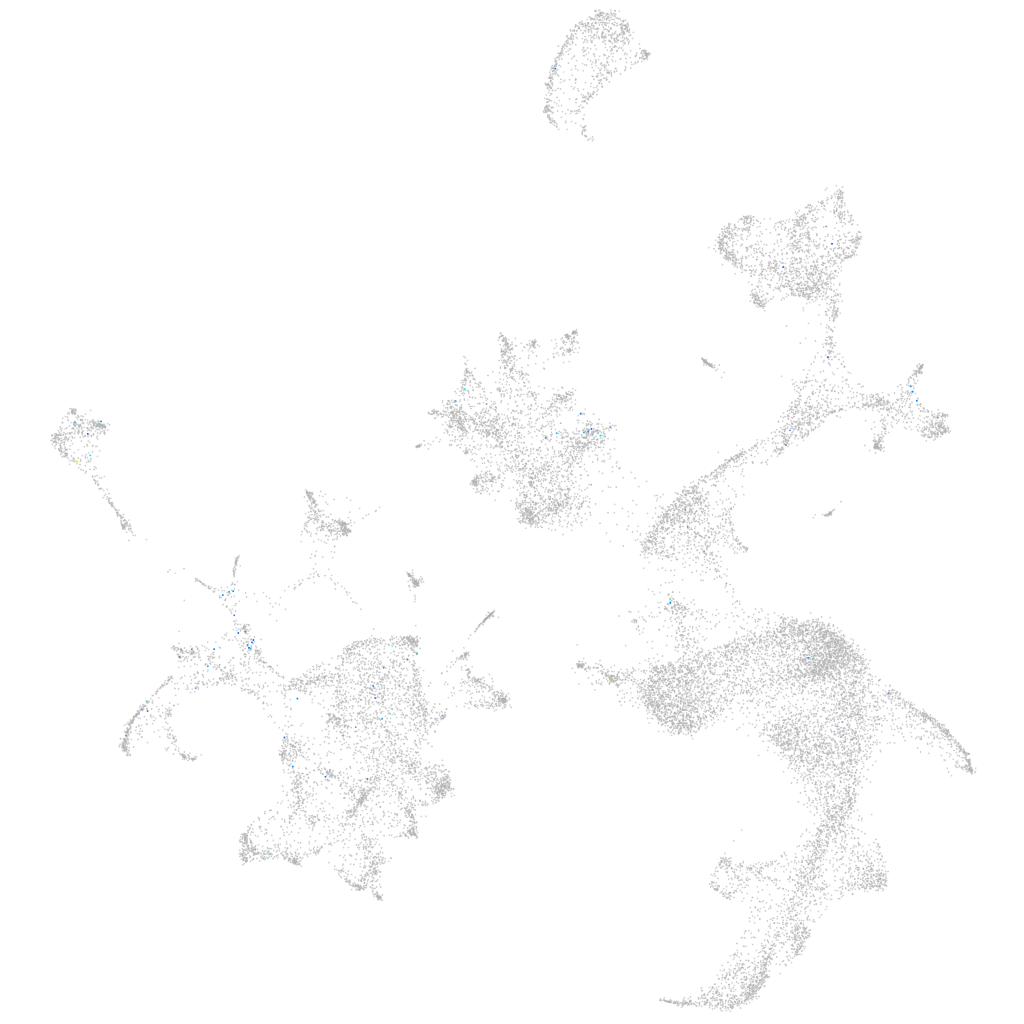
Gene expression UMAP
Display:
Expression
Stage
Other cell groups
all cells
blastomeres
PGCs
endoderm
axial mesoderm
muscle
mural cells /
non-skeletal muscle
mesenchyme
hematopoietic /
vasculature
pronephros
neural
spinal cord / glia
eye
taste / olfactory
otic / lateral line
epidermis
periderm
fin
ionocytes / mucous
pigment cells
Expression by stage/cluster
Correlated gene expression
Positive correlation
Negative correlation
Gene
r
Gene
r
XLOC-020101
0.243
hbbe1.1
-0.032
tdrd7a
0.206
hbae1.3
-0.032
LOC110437966
0.164
hbbe1.3
-0.030
si:dkey-285b23.4
0.145
prdx2
-0.030
dazl
0.136
hbae3
-0.030
nanos3
0.124
hbae1.1
-0.030
cbln17
0.118
hbbe2
-0.030
LOC110438309
0.117
vdac2
-0.028
CR974475.1
0.116
blvrb
-0.028
LOC110439385
0.115
alas2
-0.027
LOC103911969
0.109
cahz
-0.027
stk24a
0.106
hemgn
-0.026
CR354610.1
0.105
tmem14ca
-0.025
btr20
0.104
zgc:163057
-0.025
si:dkeyp-79b7.12
0.102
nt5c2l1
-0.024
LOC101883552
0.101
plac8l1
-0.024
RF00099
0.100
hbbe1.2
-0.022
CU694380.1
0.098
fth1a
-0.021
FP236457.1
0.097
gpx1a
-0.021
LOC110440188
0.097
nmt1b
-0.021
LOC108182916
0.096
tspo
-0.021
mir126b
0.096
dmtn
-0.020
LOC103909937
0.093
creg1
-0.020
si:dkey-208b23.5
0.092
tmod4
-0.019
znf1167
0.090
si:ch211-227m13.1
-0.019
BX901962.3
0.090
si:ch211-250g4.3
-0.018
LOC110438269
0.083
gabarapa
-0.018
LOC103912072
0.083
hdr
-0.018
LOC101883160
0.083
mcl1a
-0.018
cyp2x12
0.082
ucp3
-0.018
rftn1a
0.082
mibp2
-0.018
si:dkey-27d5.14
0.082
hbae5
-0.018
BX908385.1
0.082
epb41b
-0.017
fbxo43
0.081
CR293511.1
-0.017
XLOC-037648
0.080
ak3
-0.017