Daniocell
si:ch73-15b2.5 (pigment cells)
si:ch73-15b2.5
ZFIN
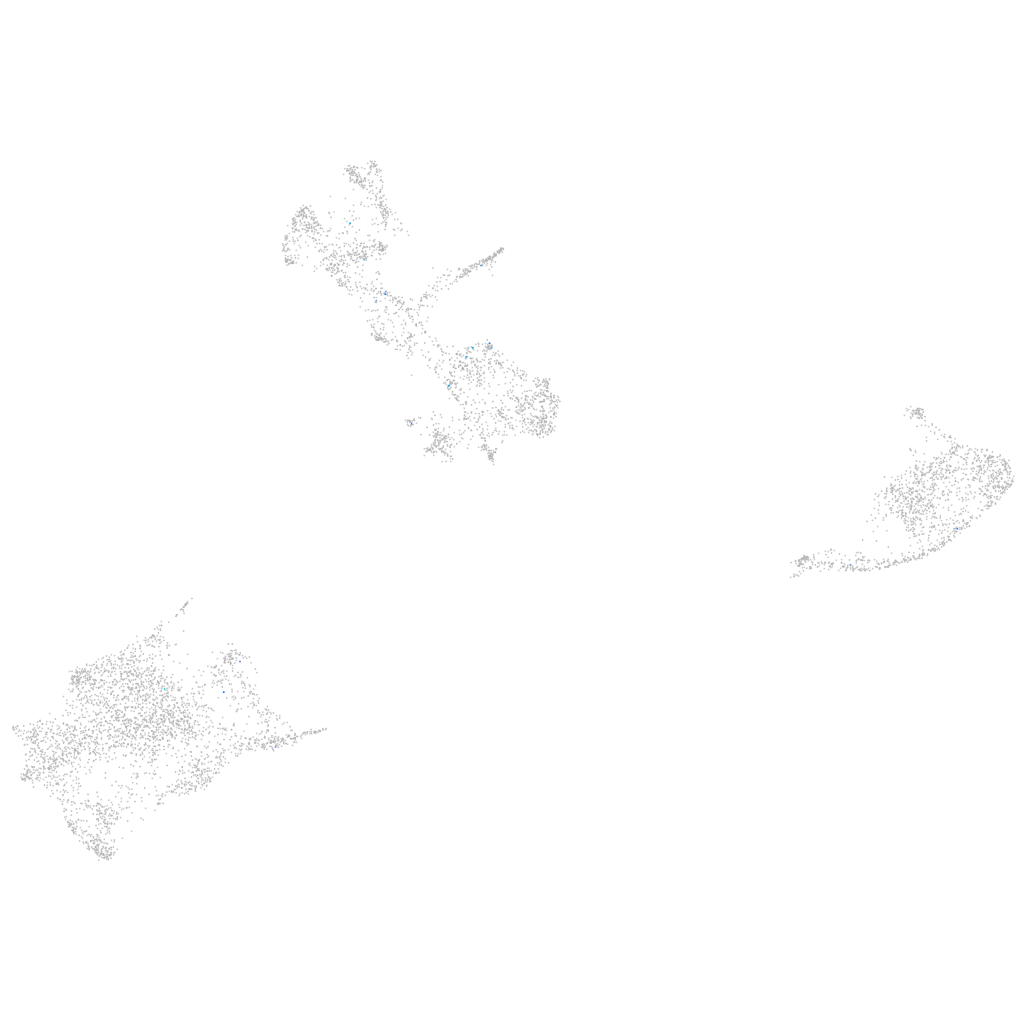
Gene expression UMAP
Display:
Expression
Stage
Other cell groups
all cells
blastomeres
PGCs
endoderm
axial mesoderm
muscle
mural cells /
non-skeletal muscle
mesenchyme
hematopoietic /
vasculature
pronephros
neural
spinal cord / glia
eye
taste / olfactory
otic / lateral line
epidermis
periderm
fin
ionocytes / mucous
pigment cells
Expression by stage/cluster
Correlated gene expression
Positive correlation
Negative correlation
Gene
r
Gene
r
si:ch1073-398f15.1
0.319
rtn1b
-0.034
LOC101885363
0.291
zgc:110339
-0.032
CT737162.1
0.291
gstp1
-0.028
BX908753.1
0.282
ahnak
-0.023
si:dkey-4c15.8
0.273
slc22a7a
-0.023
LOC103911615
0.259
actb2
-0.022
cyp27b1
0.251
s100a10b
-0.022
XLOC-031097
0.250
mlpha
-0.021
si:dkey-20i20.4
0.234
gmfb
-0.021
LOC101884821
0.232
aqp3a
-0.021
tnni3k
0.224
ap2s1
-0.020
LOC101886293
0.202
uraha
-0.020
rln1
0.191
zgc:153867
-0.020
LO018568.2
0.183
gch2
-0.020
UST (1 of many)
0.173
gpm6ab
-0.020
znf1011
0.165
tln1
-0.019
zgc:136410
0.164
C12orf75
-0.019
CR759879.1
0.163
ccni
-0.019
si:dkey-46g23.5
0.163
pfn1
-0.019
si:dkeyp-93d12.1
0.163
krt8
-0.018
si:ch211-76m11.15
0.163
gsna
-0.018
LOC561361
0.163
dio3a
-0.018
CABZ01018269.1
0.163
marcksl1b
-0.018
XLOC-005140
0.157
csrp2
-0.018
BX005396.3
0.151
rasd1
-0.018
XLOC-003147
0.150
gyg1b
-0.018
LOC108192140
0.145
anxa13l
-0.018
CR627496.1
0.140
ywhaz
-0.017
si:dkey-111k8.2
0.138
wdr1
-0.017
cysltr2a
0.137
gnb1a
-0.017
prkacba
0.135
anxa11b
-0.017
XLOC-029603
0.134
si:dkey-251i10.2
-0.017
zgc:171686
0.131
zgc:91968
-0.017
CABZ01118270.1
0.131
dct
-0.017
XLOC-043918
0.129
tmem130
-0.017