Daniocell
si:ch73-15b2.5 (pronephros)
si:ch73-15b2.5
ZFIN
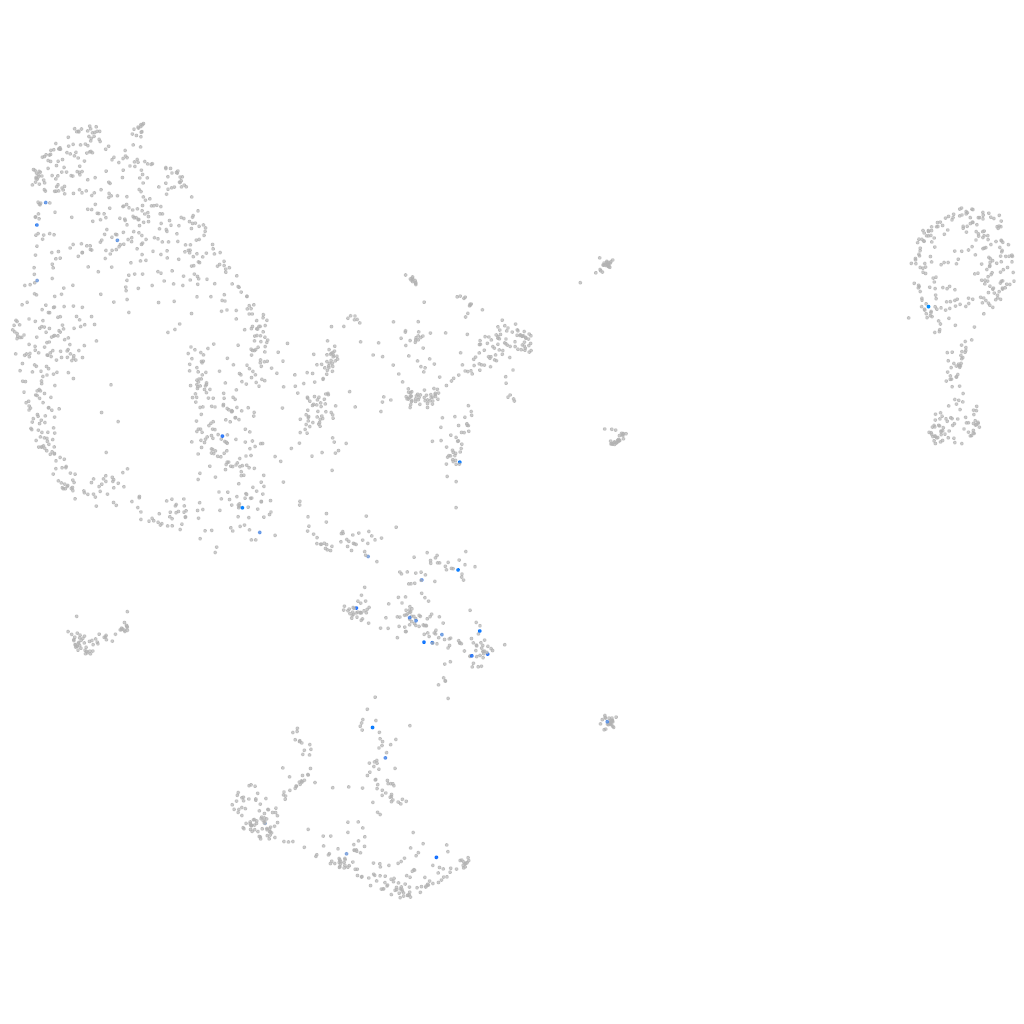
Gene expression UMAP
Display:
Expression
Stage
Other cell groups
all cells
blastomeres
PGCs
endoderm
axial mesoderm
muscle
mural cells /
non-skeletal muscle
mesenchyme
hematopoietic /
vasculature
pronephros
neural
spinal cord / glia
eye
taste / olfactory
otic / lateral line
epidermis
periderm
fin
ionocytes / mucous
pigment cells
Expression by stage/cluster
Correlated gene expression
Positive correlation
Negative correlation
Gene
r
Gene
r
si:dkeyp-94g1.1
0.319
si:ch211-139a5.9
-0.079
CR383680.1
0.302
si:dkey-16p21.8
-0.069
SCCPDH
0.302
gstr
-0.063
UST
0.302
ahcy
-0.062
abcb11a
0.301
gstt1a
-0.061
LOC101885088
0.275
cox5b2
-0.059
si:ch73-367f21.6
0.275
sod2
-0.058
XLOC-012390
0.272
aldh7a1
-0.057
eomesb
0.259
aldh6a1
-0.057
rasgrp2l
0.255
dpydb
-0.056
LOC101885180
0.253
grhprb
-0.056
znf1049
0.252
upb1
-0.056
LOC108191541
0.252
eps8l3b
-0.055
LOC108190353
0.250
hoga1
-0.054
CU651657.1
0.250
lrrc66
-0.054
si:ch211-117c9.1
0.244
si:dkey-33i11.9
-0.054
si:ch211-218m3.13
0.221
gapdh
-0.053
CR626882.3
0.216
rgrb
-0.053
gabra6a
0.214
kyat1
-0.052
si:ch73-103b2.1.1
0.210
gstk1
-0.052
nfil3-3
0.210
dhdhl
-0.052
si:dkey-23f9.8
0.201
cox8b
-0.052
BX936298.1
0.200
eno3
-0.052
LOC110439563
0.192
dab1a
-0.050
XLOC-004843
0.192
cox6a2
-0.050
LOC560870
0.189
prdx2
-0.050
si:dkey-47k20.4
0.186
gcshb
-0.050
XLOC-023228
0.184
alpl
-0.049
LOC100004160
0.183
glud1b
-0.048
CT583708.1
0.179
eef1da
-0.048
edil3b
0.175
slc26a1
-0.047
BX548024.2
0.171
ndufa7
-0.047
LOC110439298
0.170
tmprss2
-0.047
si:ch211-106h4.4
0.168
phyhd1
-0.046
LOC103908998
0.166
hao1
-0.046