Daniocell
si:ch1073-174d20.1 (taste / olfactory)
si:ch1073-174d20.1
ZFIN
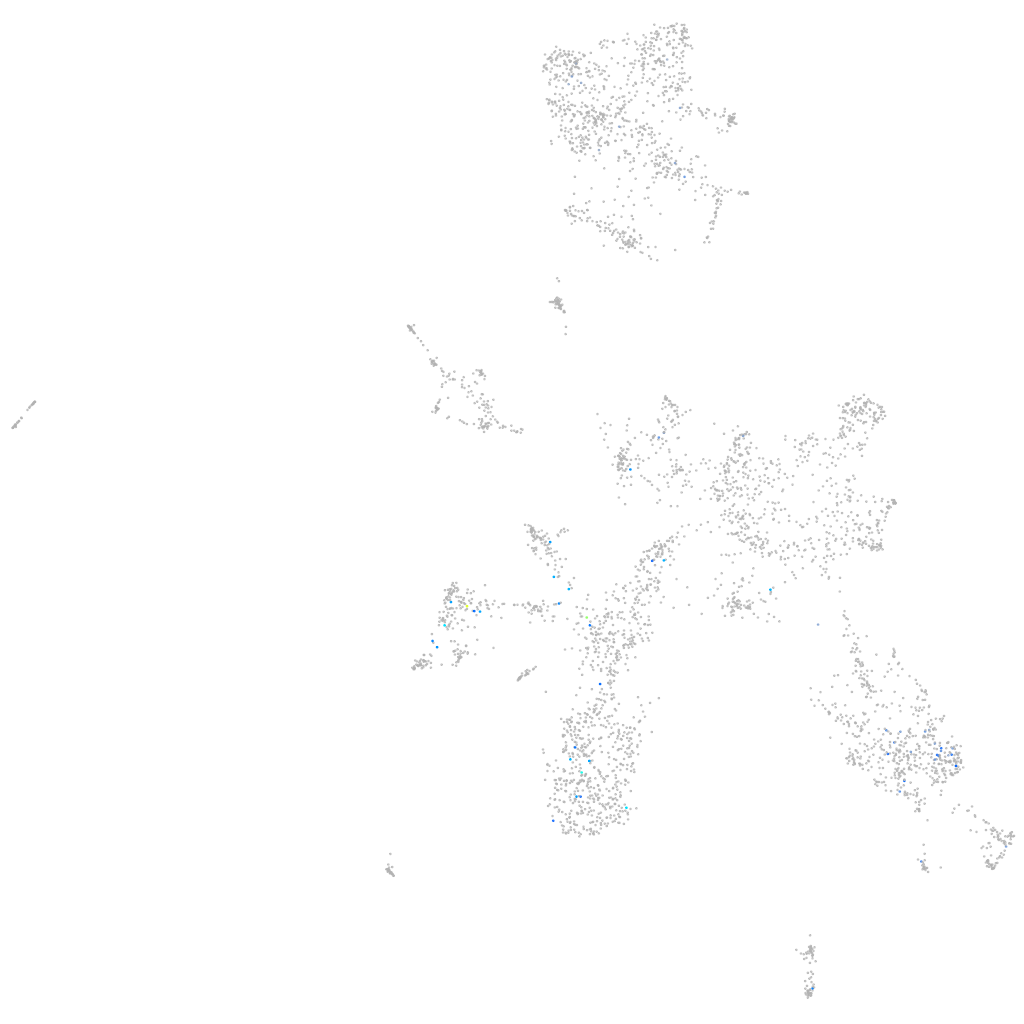
Gene expression UMAP
Display:
Expression
Stage
Other cell groups
all cells
blastomeres
PGCs
endoderm
axial mesoderm
muscle
mural cells /
non-skeletal muscle
mesenchyme
hematopoietic /
vasculature
pronephros
neural
spinal cord / glia
eye
taste / olfactory
otic / lateral line
epidermis
periderm
fin
ionocytes / mucous
pigment cells
Expression by stage/cluster
Correlated gene expression
Positive correlation
Negative correlation
Gene
r
Gene
r
LOC108191543
0.306
rpl5a
-0.067
BX294110.2
0.265
rpl39
-0.067
LOC100330653
0.265
rpl5b
-0.061
LOC103911377
0.244
alcamb
-0.059
AL845320.1
0.235
rps9
-0.057
si:ch211-253p18.2
0.218
eef2b
-0.057
LOC103910311
0.201
ccng1
-0.056
si:ch211-238e22.8
0.192
marcksl1a
-0.055
tmem54b
0.181
rpl30
-0.054
LOC103909522
0.180
rplp2l
-0.053
cdh29
0.179
rplp0
-0.052
si:dkey-205h23.2
0.173
si:ch73-281n10.2
-0.052
LOC101885178
0.173
rpl10a
-0.052
CR392042.1
0.173
rpl35a
-0.052
atad3
0.172
rps13
-0.052
LOC103910524
0.170
zgc:153713
-0.052
LOC110438880
0.170
sdc4
-0.051
TMEM200C
0.169
rps24
-0.051
si:ch211-186e20.7
0.165
pvalb8
-0.050
si:ch1073-44g3.1
0.165
eef1a1l1
-0.050
or110-1
0.164
rps15
-0.050
tmem121aa
0.157
rps18
-0.050
LOC103908925
0.154
rps3
-0.050
XLOC-014787
0.145
rpl32
-0.049
CU633479.2
0.142
rpl13a
-0.049
LOC103910818
0.142
rplp1
-0.049
LO018380.1
0.134
ptbp1a
-0.049
si:ch211-276i12.4
0.134
rps19
-0.049
AL954666.1
0.133
rps27a
-0.049
LOC101885769
0.133
nsa2
-0.049
LOC110440219
0.133
rps20
-0.048
LOC101882592
0.132
rpl14
-0.048
si:ch211-113d11.5
0.131
rps16
-0.048
XLOC-015209
0.131
rpl23a
-0.048
LOC103909158
0.130
rsl1d1
-0.048