Daniocell
si:ch1073-174d20.1 (periderm)
si:ch1073-174d20.1
ZFIN
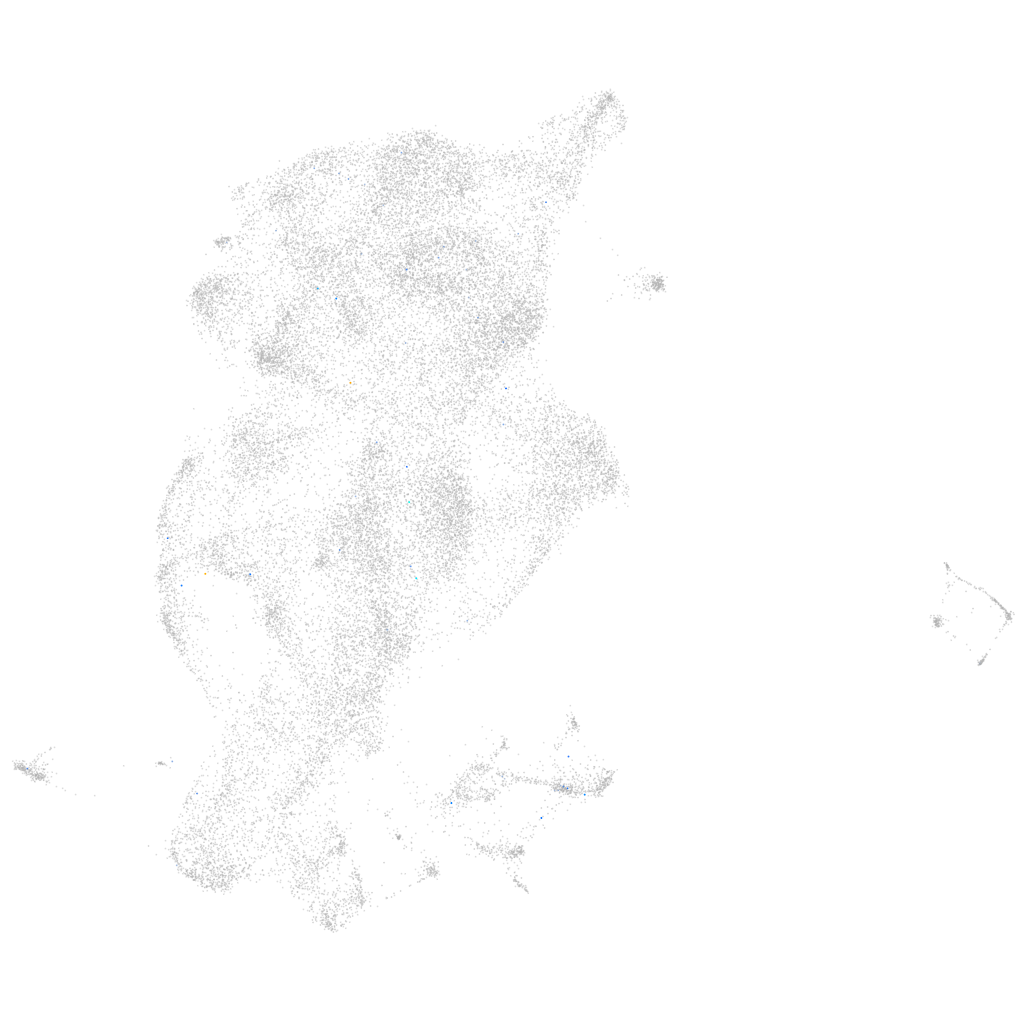
Gene expression UMAP
Display:
Expression
Stage
Other cell groups
all cells
blastomeres
PGCs
endoderm
axial mesoderm
muscle
mural cells /
non-skeletal muscle
mesenchyme
hematopoietic /
vasculature
pronephros
neural
spinal cord / glia
eye
taste / olfactory
otic / lateral line
epidermis
periderm
fin
ionocytes / mucous
pigment cells
Expression by stage/cluster
Correlated gene expression
Positive correlation
Negative correlation
Gene
r
Gene
r
klhl10a
0.316
rpl11
-0.025
ttc7a
0.260
zgc:193505
-0.023
XLOC-042930
0.148
si:ch211-125o16.4
-0.022
CU914622.1
0.142
capns1a
-0.021
si:ch73-287m6.1
0.139
anxa1a
-0.021
mir457a
0.118
lye
-0.020
LOC560870
0.116
rps16
-0.019
fgf1a
0.116
s100a10b
-0.018
dym
0.114
zgc:110333
-0.018
BX465186.1
0.109
rack1
-0.018
si:dkey-30e9.6
0.104
rps19
-0.018
si:dkey-238d18.3
0.101
serbp1a
-0.017
FO744840.1
0.101
tmem45b
-0.017
si:dkey-15h8.10
0.093
rps25
-0.016
si:ch211-113d22.2
0.090
fbp1a
-0.016
acsl4a
0.089
si:ch211-157c3.4
-0.016
hhatla
0.086
btg2
-0.016
si:dkey-192l18.9
0.085
ckap4
-0.016
ank1a
0.083
aldob
-0.016
abr
0.083
tob1b
-0.016
si:ch211-219a15.4
0.080
chmp1b
-0.015
si:cabz01090193.1
0.079
pfn1
-0.015
XLOC-014889
0.079
pycard
-0.015
gng12a
0.078
icn2
-0.015
dnah5
0.076
rpl10
-0.015
CR788254.2
0.076
XLOC-044191
-0.015
mier1b
0.073
perp
-0.015
cyp26a1
0.073
lasp1
-0.015
NPC2
0.073
pnp5a
-0.014
tnni4b.1
0.070
cldne
-0.014
zgc:194336
0.069
ywhabl
-0.014
si:ch211-171l17.14
0.068
elovl1a
-0.014
cetn3
0.065
nfkbiaa
-0.014
xrra1
0.064
si:dkey-87o1.2
-0.014
rspo2
0.064
fth1a
-0.014