Daniocell
si:ch1073-174d20.1 (hematopoietic / vasculature)
si:ch1073-174d20.1
ZFIN
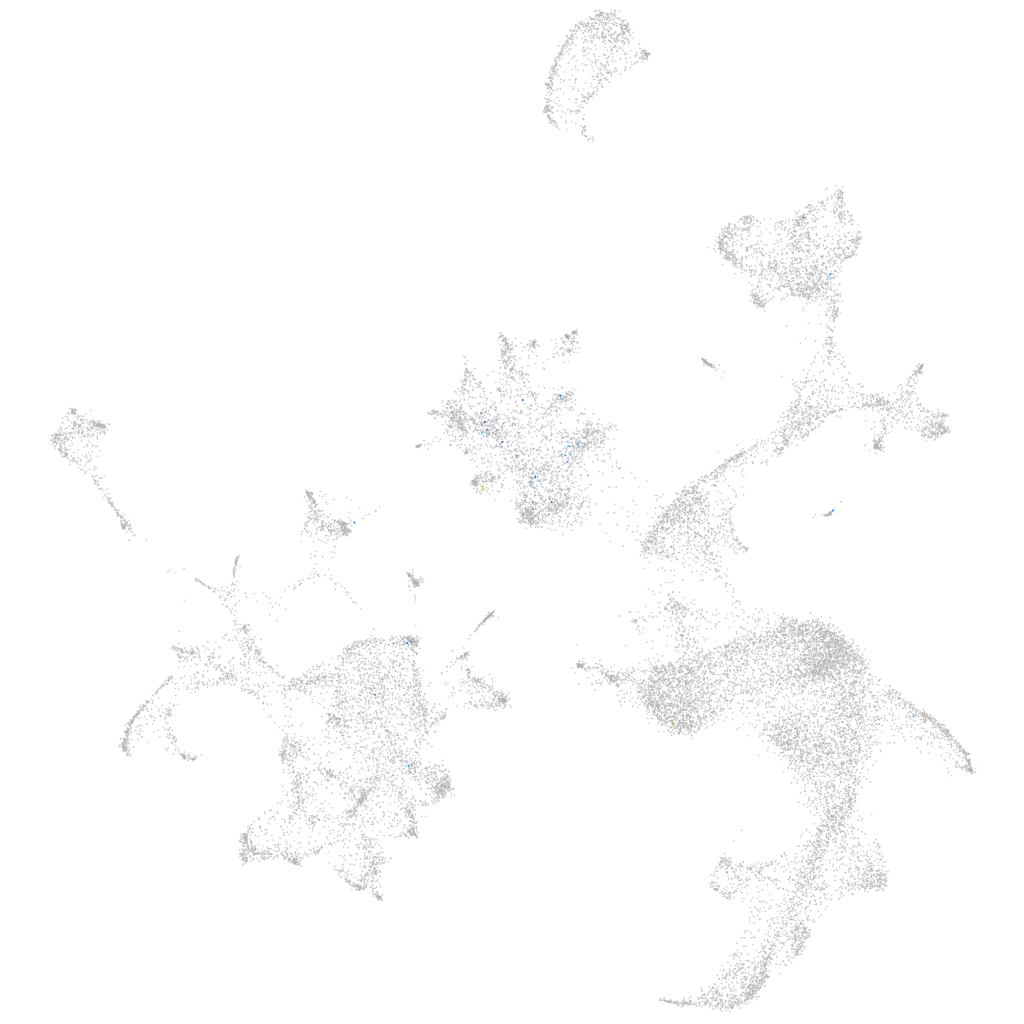
Gene expression UMAP
Display:
Expression
Stage
Other cell groups
all cells
blastomeres
PGCs
endoderm
axial mesoderm
muscle
mural cells /
non-skeletal muscle
mesenchyme
hematopoietic /
vasculature
pronephros
neural
spinal cord / glia
eye
taste / olfactory
otic / lateral line
epidermis
periderm
fin
ionocytes / mucous
pigment cells
Expression by stage/cluster
Correlated gene expression
Positive correlation
Negative correlation
Gene
r
Gene
r
LOC110439775
0.210
lmo2
-0.016
CR774179.2
0.175
tspo
-0.014
rltgr
0.174
tmod4
-0.013
LOC100004944
0.152
nrros
-0.013
si:dkey-286h21.1
0.152
slc4a1a
-0.013
LOC103908992
0.150
znfl2a
-0.013
LOC110438512
0.148
TCIM (1 of many)
-0.012
elnb
0.145
blvra
-0.012
scn12aa
0.142
plac8l1
-0.012
rasgrf2a
0.139
DIPK2B
-0.012
LOC108182859
0.129
itm2bb
-0.011
fgf6a
0.128
exosc3
-0.011
LOC108183814
0.127
LOC110439372
-0.011
st6galnac5a
0.127
hspa8
-0.011
LOC103909118
0.126
uros
-0.011
tjp2a
0.125
odc1
-0.010
acana
0.121
sult2st1
-0.010
si:ch211-255f4.13
0.121
atp1b1a
-0.010
LO018250.1
0.116
cxcr4b
-0.010
gsg1l2b
0.116
gata1a
-0.010
mir19c
0.114
ctss2.1
-0.010
mtmr7b
0.114
si:ch73-248e21.7
-0.010
tnni1c
0.114
blf
-0.010
tmem200a
0.106
eif3c
-0.010
abcg1
0.105
urod
-0.010
trim63a
0.102
tram1
-0.010
si:ch211-13f8.1
0.101
slc11a2
-0.010
si:dkey-15h8.17
0.101
NC-002333.17
-0.010
LOC108191636
0.099
phlda2
-0.010
XLOC-023369
0.099
hbbe3
-0.010
trpm1a
0.098
aldh1l2
-0.010
AL954695.1
0.098
nol12
-0.010
gramd4a
0.098
rab8b
-0.010
LOC799574
0.095
txnipa
-0.010
zgc:112001
0.095
RASSF5
-0.010