Daniocell
si:ch1073-174d20.1 (pigment cells)
si:ch1073-174d20.1
ZFIN
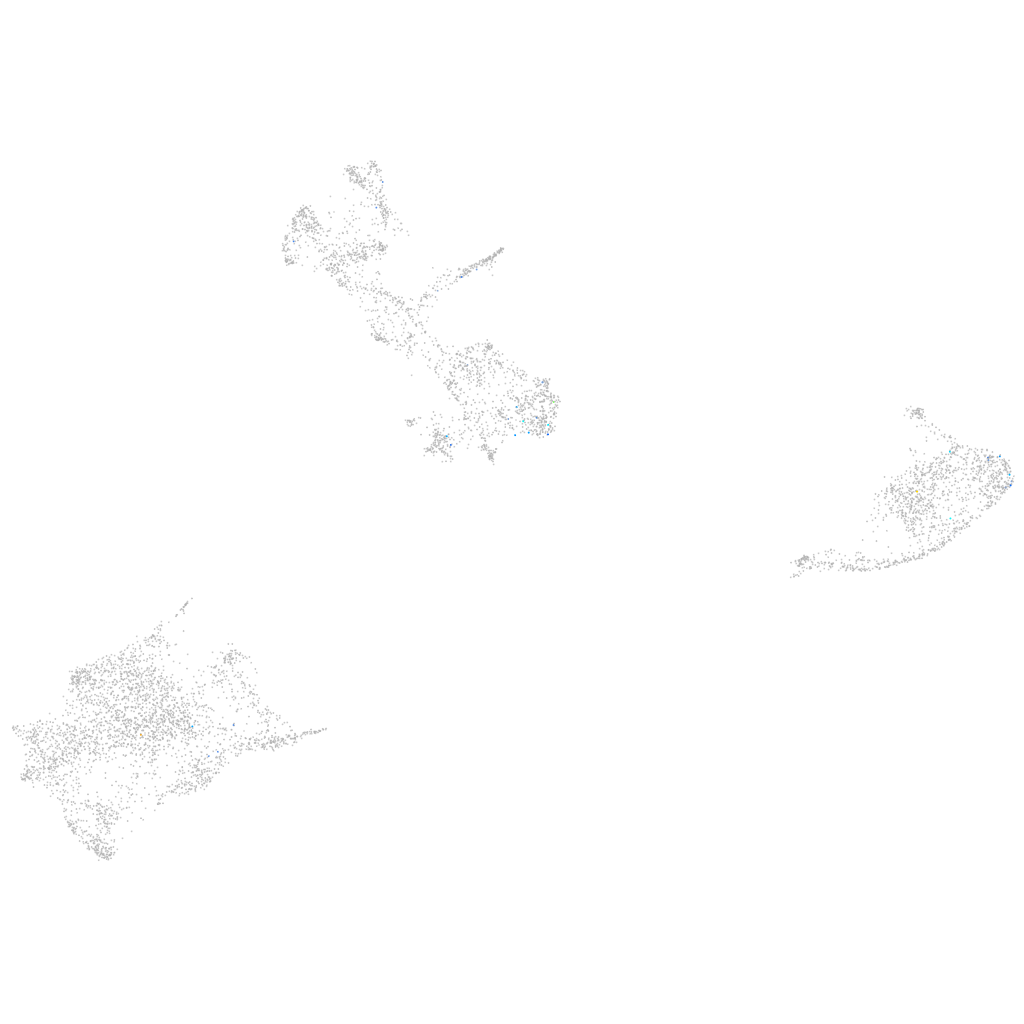
Gene expression UMAP
Display:
Expression
Stage
Other cell groups
all cells
blastomeres
PGCs
endoderm
axial mesoderm
muscle
mural cells /
non-skeletal muscle
mesenchyme
hematopoietic /
vasculature
pronephros
neural
spinal cord / glia
eye
taste / olfactory
otic / lateral line
epidermis
periderm
fin
ionocytes / mucous
pigment cells
Expression by stage/cluster
Correlated gene expression
Positive correlation
Negative correlation
Gene
r
Gene
r
mctp1b
0.295
rplp0
-0.047
LOC108182890
0.282
rps7
-0.035
pimr74
0.261
impdh1b
-0.035
LOC101887122
0.260
rpl27
-0.035
CR352243.2
0.245
pfn1
-0.032
XLOC-027664
0.241
hbbe1.3
-0.031
si:ch73-261i21.2
0.225
rnaseka
-0.030
CABZ01046949.1
0.225
rpl19
-0.028
XLOC-022751
0.205
aox5
-0.026
AL772314.1
0.202
gpd1b
-0.026
LOC108180795
0.198
npm1a
-0.026
trpc5b
0.174
zgc:113337
-0.026
AL954149.2
0.173
si:dkey-251i10.2
-0.026
si:ch211-244a23.1
0.168
prtfdc1
-0.025
si:ch73-281i18.6
0.166
rps5
-0.025
lim2.5
0.164
ostc
-0.024
LOC103910704
0.159
rps14
-0.024
clmn
0.156
sigmar1
-0.024
ndufs1
0.155
hmga1a
-0.024
ephb1
0.155
arpc3
-0.023
XLOC-043659
0.149
phyhd1
-0.023
cacna1ha
0.143
alas1
-0.023
CABZ01102518.1
0.143
psmb7
-0.023
CR847844.1
0.140
adi1
-0.023
apba2a
0.136
prps1a
-0.023
CABZ01043955.1
0.136
npc2
-0.023
zgc:194629
0.136
si:ch211-243a20.3
-0.023
adra2db
0.135
aclya
-0.022
atp6v0a1b
0.133
ppat
-0.022
LOC101883768
0.129
shmt1
-0.022
cfhl1
0.128
hbae3
-0.022
RNF157
0.127
zgc:56493
-0.022
XLOC-034224
0.126
mibp
-0.022
BX571952.1
0.124
akr1b1
-0.022
galnt13
0.124
CABZ01021592.1
-0.022