Daniocell
psmf1 (pigment cells)
proteasome inhibitor subunit 1
ZFIN
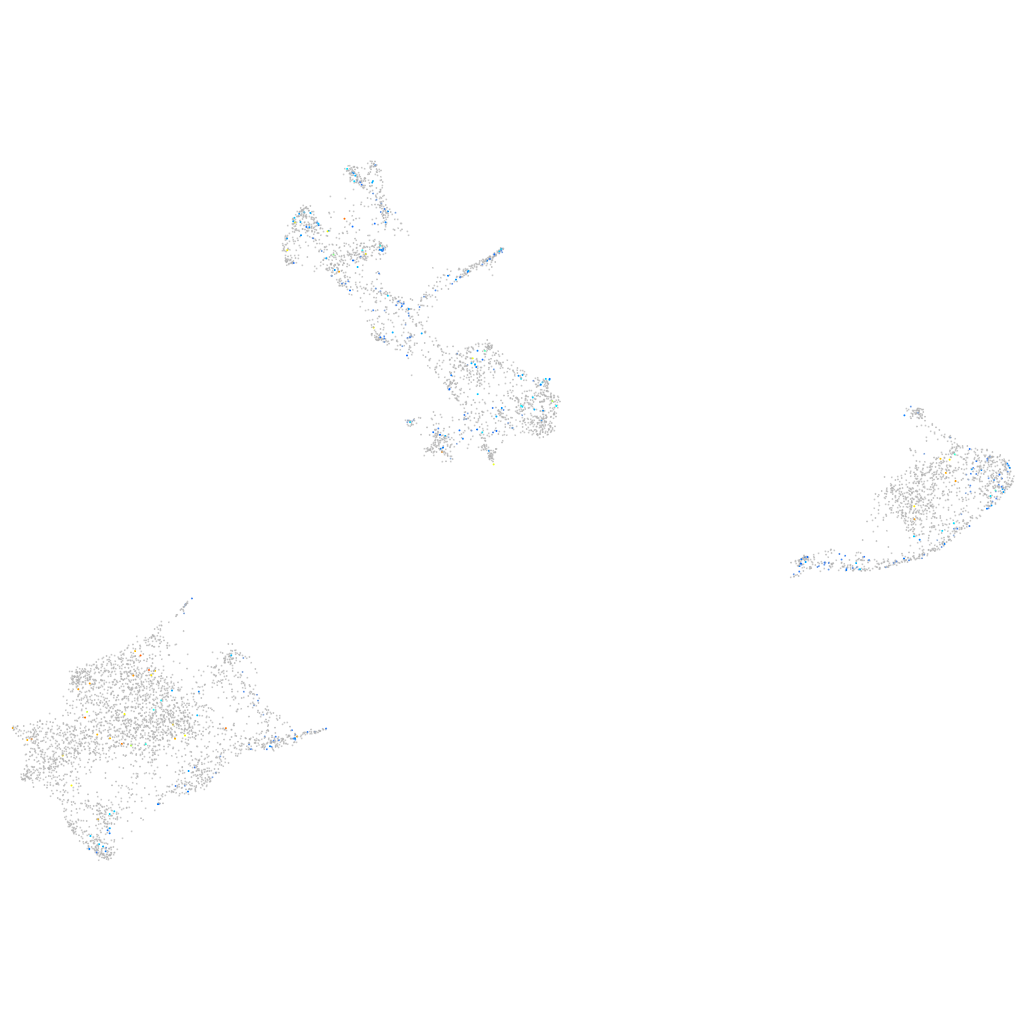
Gene expression UMAP
Display:
Expression
Stage
Other cell groups
all cells
blastomeres
PGCs
endoderm
axial mesoderm
muscle
mural cells /
non-skeletal muscle
mesenchyme
hematopoietic /
vasculature
pronephros
neural
spinal cord / glia
eye
taste / olfactory
otic / lateral line
epidermis
periderm
fin
ionocytes / mucous
pigment cells
Expression by stage/cluster
Correlated gene expression
Positive correlation
Negative correlation
Gene
r
Gene
r
slc22a5
0.138
gch2
-0.063
znf1050
0.124
si:dkey-251i10.2
-0.054
LOC110437989
0.122
slc22a7a
-0.054
syn3
0.119
CABZ01021592.1
-0.054
XLOC-042570
0.117
tmem130
-0.046
si:cabz01069015.1
0.111
pts
-0.043
CR513782.1
0.107
sult1st1
-0.043
znf1111
0.101
gstp1
-0.040
enpp7.1
0.100
aox5
-0.040
nipsnap1
0.099
uraha
-0.037
AL954134.1
0.099
aqp3a
-0.037
zgc:109913
0.096
akr1b1
-0.035
tmco6
0.096
prdx1
-0.035
umodl1
0.095
sprb
-0.035
si:zfos-464b6.2
0.094
aldob
-0.035
cx28.6
0.093
hbae1.1
-0.033
tinagl1
0.093
cyb5a
-0.033
fip1l1a
0.093
iah1
-0.033
CR751224.1
0.091
cd63
-0.032
LOC108182812
0.090
si:ch211-251b21.1
-0.032
si:ch211-175f11.5
0.089
rbp4l
-0.031
prf1.5
0.088
gpd1b
-0.031
gys2
0.087
epdr1
-0.030
ADAMTS7
0.086
si:dkey-126g1.9
-0.030
CT573446.1
0.085
mdh1aa
-0.029
tmem125
0.085
oacyl
-0.029
MARCH4 (1 of many)
0.084
aldh1l1
-0.029
tnni2a.2
0.084
XLOC-016325
-0.029
zgc:136472
0.084
bscl2l
-0.028
rasal1a
0.084
asip2b
-0.027
abcg2d
0.083
zgc:110339
-0.026
tekt2
0.081
mfsd10
-0.025
XLOC-005124
0.080
cyb561a3b
-0.025
LOC101882771
0.080
lye
-0.025
XLOC-024629
0.079
si:dkey-73n8.3
-0.024