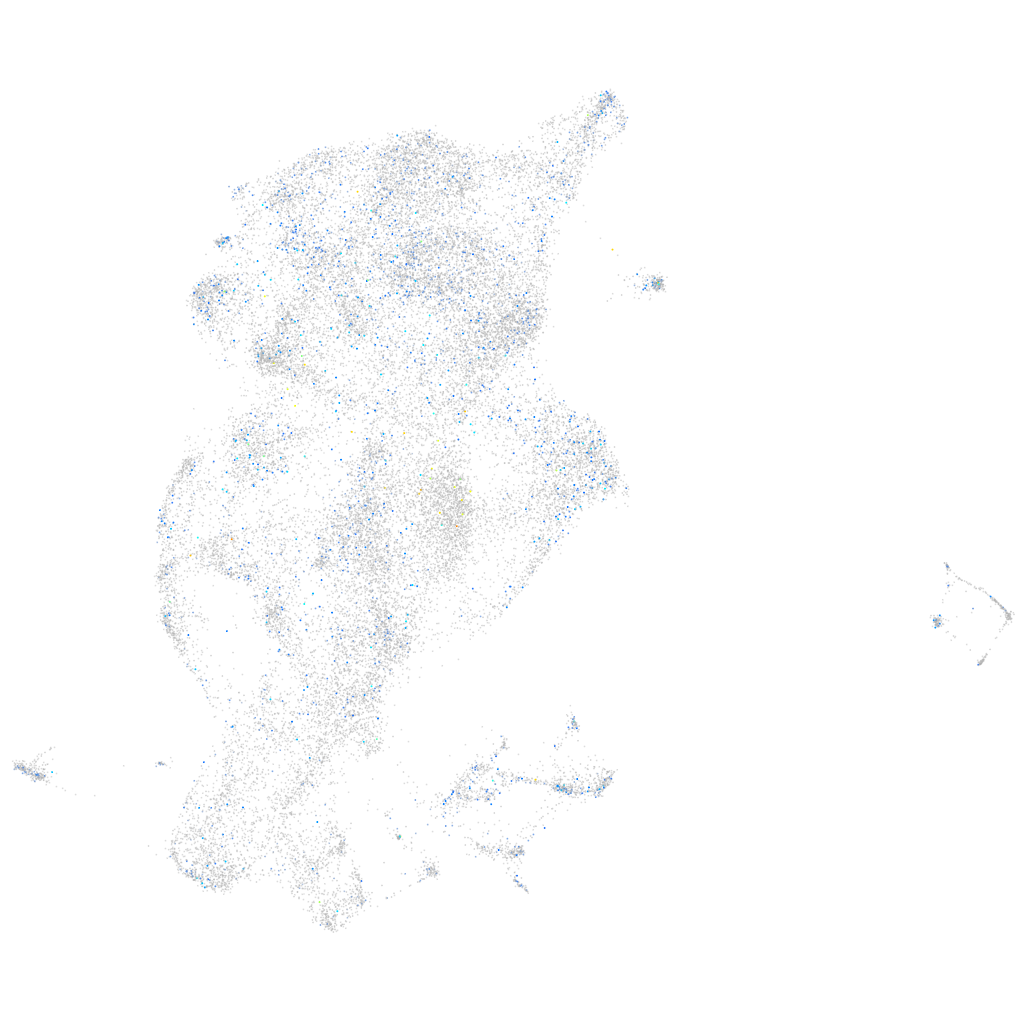
Daniocell
psmf1 (periderm)
proteasome inhibitor subunit 1
ZFIN
Gene expression UMAP
Display:
Expression
Stage
Other cell groups
all cells
blastomeres
PGCs
endoderm
axial mesoderm
muscle
mural cells /
non-skeletal muscle
mesenchyme
hematopoietic /
vasculature
pronephros
neural
spinal cord / glia
eye
taste / olfactory
otic / lateral line
epidermis
periderm
fin
ionocytes / mucous
pigment cells
Expression by stage/cluster
Correlated gene expression
Positive correlation
Negative correlation
Gene
r
Gene
r
SPATA1
0.066
cyt1l
-0.041
si:dkey-83f18.6
0.065
krt4
-0.041
si:ch211-165f21.4
0.065
krt92
-0.041
LOC100331720
0.063
tgm1l4
-0.032
si:ch211-207n23.2
0.061
rtn3
-0.032
ctsz
0.060
icn
-0.032
LOC100334365
0.059
osgn1
-0.030
ctss2.2
0.056
si:ch211-202h22.8
-0.029
gbp1
0.056
lrrc20
-0.029
si:dkey-33c14.3
0.054
tmsb1
-0.029
LOC100330744
0.053
ywhaz
-0.029
ctsla
0.052
cst14b.1
-0.028
si:dkey-247k7.2
0.052
adh8b
-0.028
cox4i1
0.052
agr1
-0.027
LOC103911301
0.051
XLOC-032526
-0.027
cd63
0.050
wu:fb18f06
-0.026
BX323074.2
0.050
cyp2y3
-0.026
XLOC-035162
0.049
XLOC-041945
-0.026
b2ml
0.049
cyt1
-0.025
armc3
0.049
naalad2
-0.025
hspa8
0.049
myh9a
-0.025
zgc:111983
0.048
gale
-0.024
ifi46
0.048
cxcl14
-0.024
nme2b.1
0.048
BX927258.1
-0.023
LOC108180199
0.048
uraha
-0.023
mhc1zba
0.048
uox
-0.023
LOC101882910
0.047
nos1
-0.022
LOC100535095
0.047
XLOC-039121
-0.022
psmb1
0.046
anxa1c
-0.022
wu:fa03e10
0.046
pabpc1b
-0.022
ucp2
0.046
agpat4
-0.022
XLOC-003052
0.046
aep1
-0.021
CABZ01079853.1
0.045
kdelr2b
-0.021
zgc:152791
0.045
otc
-0.021
sod1
0.045
LOC799574
-0.020