Daniocell
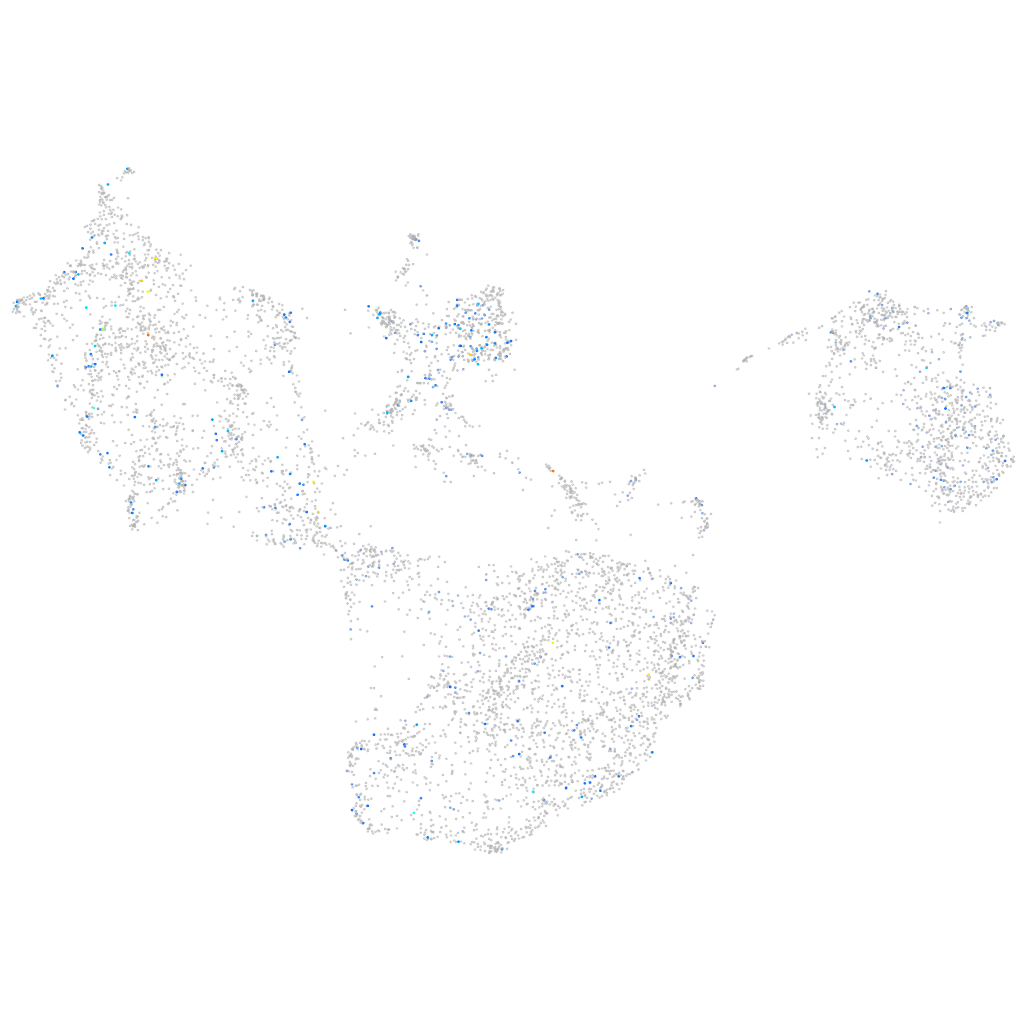
psmf1 (fin)
proteasome inhibitor subunit 1
ZFIN
Gene expression UMAP
Display:
Expression
Stage
Other cell groups
all cells
blastomeres
PGCs
endoderm
axial mesoderm
muscle
mural cells /
non-skeletal muscle
mesenchyme
hematopoietic /
vasculature
pronephros
neural
spinal cord / glia
eye
taste / olfactory
otic / lateral line
epidermis
periderm
fin
ionocytes / mucous
pigment cells
Expression by stage/cluster
Correlated gene expression
Positive correlation
Negative correlation
Gene
r
Gene
r
pth1ra
0.165
s100a10b
-0.046
cart1
0.161
tmsb1
-0.046
si:ch211-202c21.7
0.140
cfl1l
-0.046
cd44b
0.127
pfn1
-0.044
rftn1a
0.127
plecb
-0.044
CABZ01117348.1
0.125
cldn1
-0.044
ccl34a.4
0.116
pleca
-0.043
nid2b
0.113
myh9a
-0.042
pimr128
0.110
tmsb4x
-0.042
XLOC-008016
0.104
cyt1
-0.042
LOC100148648
0.103
thy1
-0.041
st6galnac3
0.101
cldni
-0.041
cp
0.096
col17a1a
-0.040
dzank1
0.096
zgc:86896
-0.040
tmc5
0.095
si:dkey-248g15.3
-0.040
zgc:113516.1
0.094
krt5
-0.040
tmc8
0.094
hbegfa
-0.040
CABZ01064771.1
0.094
itgb4
-0.040
hyal3
0.094
ecrg4b
-0.040
gpr182
0.094
krt4
-0.038
si:dkey-19c16.12
0.094
cotl1
-0.038
XLOC-016003
0.093
si:dkey-102c8.3
-0.037
XLOC-005615
0.092
spaca4l
-0.037
OSCP1 (1 of many)
0.092
itgb3a
-0.036
LOC108182290
0.092
igfbp1a
-0.036
LOC101884792
0.091
flna
-0.036
XLOC-036510
0.090
and3
-0.036
CR450780.3
0.088
si:ch73-173h19.3
-0.036
neurod6a
0.088
ptgdsb.1
-0.035
si:ch211-246e12.3
0.088
cyt1l
-0.035
ccr9b
0.087
krt91
-0.034
gys2
0.087
col11a1a
-0.034
si:ch211-196f2.6
0.087
anxa1a
-0.034
hmgb1b
0.087
si:rp71-77l1.1
-0.034
rnasekb
0.086
lgals1l1
-0.033