Daniocell
psmf1 (mural cells / non-skeletal muscle)
proteasome inhibitor subunit 1
ZFIN
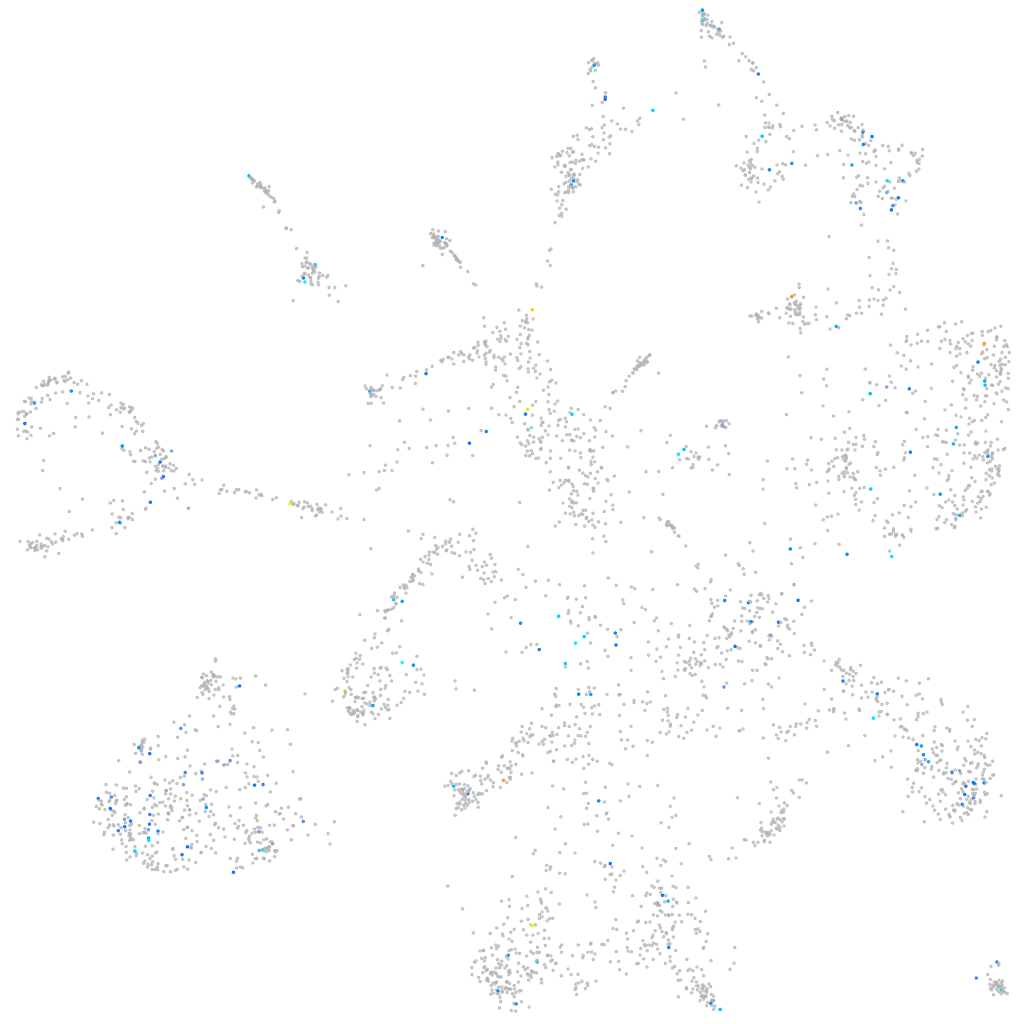
Gene expression UMAP
Display:
Expression
Stage
Other cell groups
all cells
blastomeres
PGCs
endoderm
axial mesoderm
muscle
mural cells /
non-skeletal muscle
mesenchyme
hematopoietic /
vasculature
pronephros
neural
spinal cord / glia
eye
taste / olfactory
otic / lateral line
epidermis
periderm
fin
ionocytes / mucous
pigment cells
Expression by stage/cluster
Correlated gene expression
Positive correlation
Negative correlation
Gene
r
Gene
r
gpr4
0.201
hip1
-0.043
XLOC-009632
0.191
CABZ01039304.1
-0.038
si:ch211-156l18.4
0.181
prkar1aa
-0.036
c8b
0.173
cacna1c
-0.035
CU695073.1
0.167
lrp1aa
-0.035
zgc:65851
0.164
sdk2b
-0.035
si:cabz01076231.1
0.152
inpp5l
-0.035
si:ch73-190m4.1
0.145
ptprda
-0.034
BX005129.4
0.143
serpinh2
-0.034
pcdh2g10
0.142
itgav
-0.034
pip5k1ba
0.136
plp2
-0.033
kcnq4
0.132
tmem243b
-0.033
CU855552.1
0.126
col12a1b
-0.033
si:ch211-161h7.8
0.125
mettl5
-0.032
timp4.1
0.123
itgb3b
-0.031
LOC110439967
0.123
si:ch73-217n20.1
-0.031
zgc:194990
0.122
cacna2d1a
-0.031
si:dkey-28d5.11
0.116
rfc1
-0.031
si:dkey-267n13.1
0.116
MARK4
-0.030
si:ch211-197e7.3
0.114
esyt2a
-0.030
LOC101883106
0.112
zgc:77929
-0.030
BX649350.2
0.109
mir214a
-0.029
lctla
0.109
fn1b
-0.029
LOC103911496
0.107
LO018340.1
-0.029
mtcl1
0.106
actn3a
-0.029
zmp:0000001161
0.105
rpl38
-0.029
si:busm1-194e12.8
0.105
ctif
-0.029
tmem14cb
0.105
BX571880.1
-0.029
sycn.1
0.105
fibpa
-0.029
LOC100535131
0.104
nradd
-0.028
nat6
0.104
gabrz
-0.028
LOC110440045
0.102
rasl11b
-0.028
AL954146.1
0.101
pkp4
-0.028
lect2l
0.101
narfl
-0.028
ints9
0.100
zgc:86709
-0.028