Daniocell
picalma (fin)
phosphatidylinositol binding clathrin assembly protein a
ZFIN
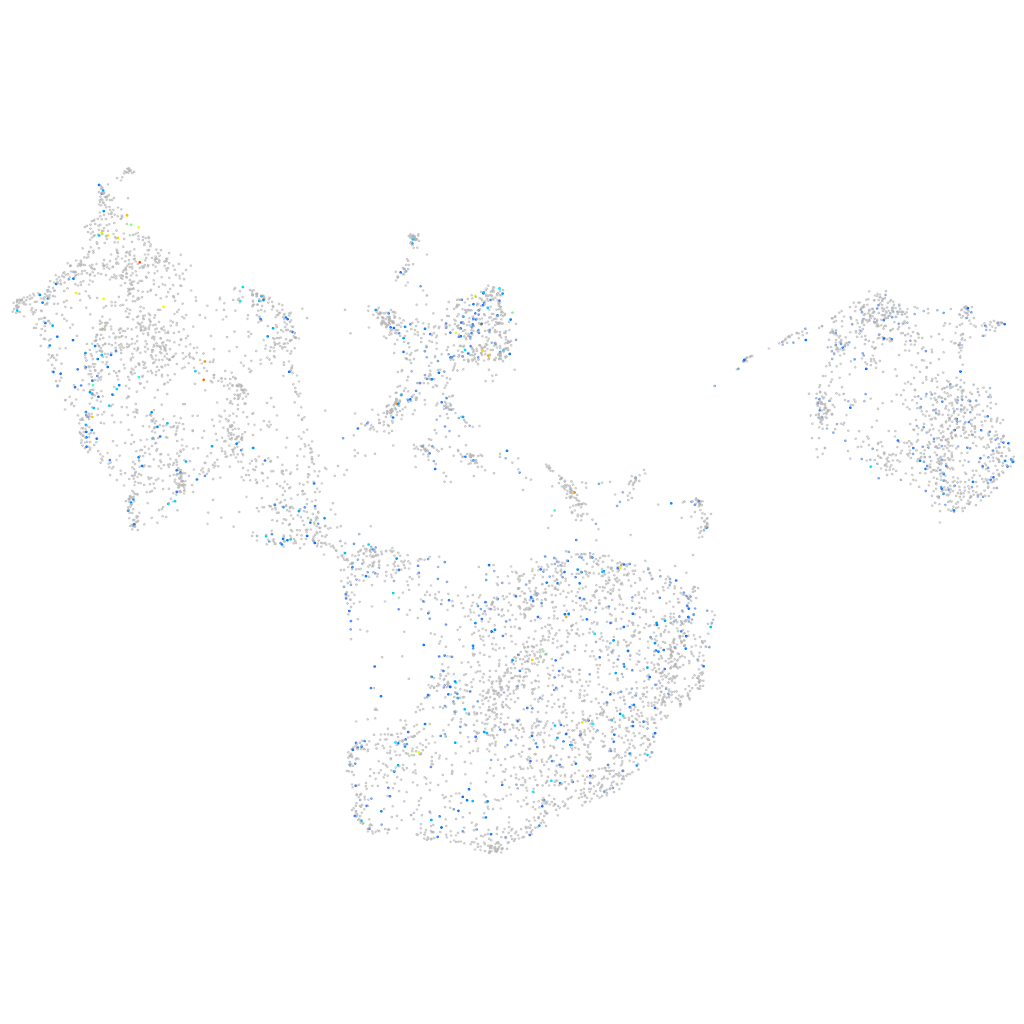
Gene expression UMAP
Display:
Expression
Stage
Other cell groups
all cells
blastomeres
PGCs
endoderm
axial mesoderm
muscle
mural cells /
non-skeletal muscle
mesenchyme
hematopoietic /
vasculature
pronephros
neural
spinal cord / glia
eye
taste / olfactory
otic / lateral line
epidermis
periderm
fin
ionocytes / mucous
pigment cells
Expression by stage/cluster
Correlated gene expression
Positive correlation
Negative correlation
Gene
r
Gene
r
BX942846.1
0.133
rps29
-0.039
BX681417.2
0.131
aldob
-0.037
CABZ01109081.1
0.121
tefa
-0.035
BX927122.2
0.115
selenow2b
-0.034
zgc:153738
0.115
llph
-0.034
CR848749.2
0.115
bccip
-0.033
BX470218.1
0.110
krt17
-0.032
si:ch73-233f7.3
0.109
zgc:193812
-0.032
gabrb1
0.102
si:dkey-247k7.2
-0.032
si:ch211-173n18.3
0.102
mgst1.2
-0.031
LOC101885872
0.100
cmah
-0.031
olig1
0.098
si:ch73-52f15.5
-0.031
CABZ01040999.1
0.097
rpl10
-0.031
LOC108183785
0.095
tktb
-0.030
zgc:114120
0.095
ddx21
-0.030
XLOC-026454
0.094
tsr1
-0.030
LOC108184012
0.094
sft2d2a
-0.030
hck
0.093
dnm3a
-0.030
si:ch73-190f9.4
0.092
stard14
-0.029
cyp27a1.2
0.089
zgc:194839
-0.029
BX548032.1
0.088
scel
-0.028
rnasel3
0.088
si:dkeyp-1h4.6
-0.028
LOC101885373
0.088
tmem45b
-0.028
iqsec3a
0.086
nhp2
-0.028
zgc:101100
0.085
si:dkey-180p18.9
-0.028
slitrk2
0.085
apodb
-0.028
znf804a
0.084
eif4ebp3
-0.028
ptger4a
0.084
abhd18
-0.028
LOC101885894
0.083
zgc:123217
-0.028
jagn1a
0.083
rpp30
-0.028
si:ch73-338o16.4
0.083
prkchb
-0.028
si:ch73-29c22.1
0.082
tab1
-0.028
stard5
0.082
nop14
-0.027
si:dkeyp-3f10.16
0.082
stx11b.1
-0.027
si:ch211-1o7.3
0.080
polr2k
-0.027