Daniocell
picalma (periderm)
phosphatidylinositol binding clathrin assembly protein a
ZFIN
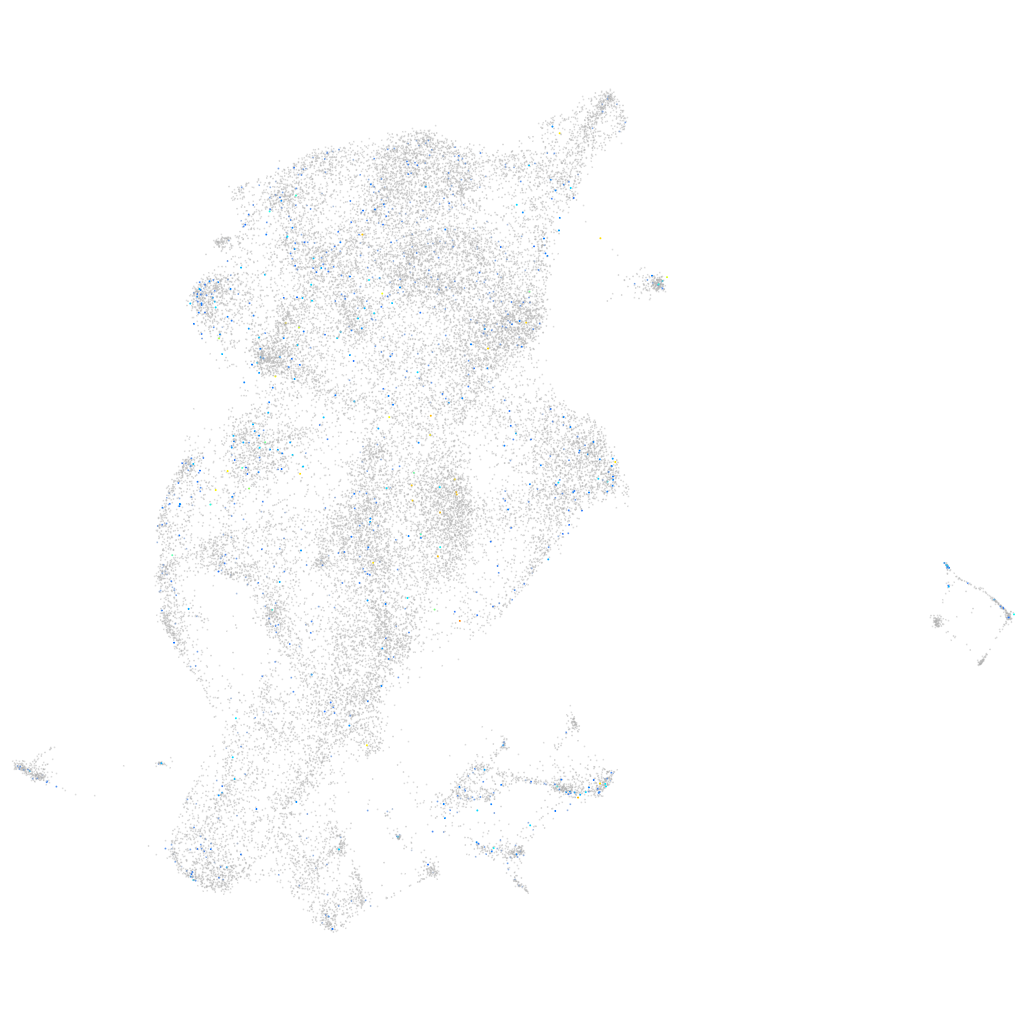
Gene expression UMAP
Display:
Expression
Stage
Other cell groups
all cells
blastomeres
PGCs
endoderm
axial mesoderm
muscle
mural cells /
non-skeletal muscle
mesenchyme
hematopoietic /
vasculature
pronephros
neural
spinal cord / glia
eye
taste / olfactory
otic / lateral line
epidermis
periderm
fin
ionocytes / mucous
pigment cells
Expression by stage/cluster
Correlated gene expression
Positive correlation
Negative correlation
Gene
r
Gene
r
XLOC-023755
0.102
krt4
-0.058
CU928069.1
0.098
cyt1
-0.052
LOC101882789
0.092
cyt1l
-0.052
dpp6a
0.090
krt5
-0.042
rsph9
0.087
agr1
-0.041
grin2ab
0.086
wu:fb18f06
-0.040
LOC110438084
0.083
zgc:193505
-0.039
pcdh1g9
0.082
zgc:175088
-0.036
crhr2.1
0.076
icn2
-0.036
CR388231.1
0.076
si:ch211-195b11.3
-0.035
LOC110437978
0.076
cst14b.1
-0.034
LOC108191536
0.075
s100a10b
-0.033
LOC101882750
0.074
zgc:174938
-0.033
micall2a
0.074
krt17
-0.031
kcnq5b
0.074
cyp2y3
-0.031
zgc:77058
0.073
si:ch211-157c3.4
-0.031
LOC108184024
0.070
anxa1c
-0.030
CU329666.1
0.069
si:dkey-184p9.7
-0.030
ntm
0.068
gsta.1
-0.029
asb10
0.068
selenow1
-0.029
zgc:154125
0.065
tgm1l4
-0.028
CR855320.1
0.064
myl12.1
-0.028
BX649484.1
0.064
tuba8l2
-0.027
kcnk2b
0.063
krt92
-0.027
il17a/f2
0.063
anxa2a
-0.026
chrm3a
0.063
si:cabz01007794.1
-0.026
LOC108191933
0.062
icn
-0.026
LOC101882691
0.062
cfl1l
-0.026
XLOC-043043
0.062
si:dkey-16p21.8
-0.025
buc
0.062
aldob
-0.025
si:dkey-31e10.1
0.062
osgn1
-0.024
rims4
0.061
tspo
-0.023
BX908386.1
0.061
capn9
-0.023
XLOC-020172
0.060
mgst2
-0.023
fyna
0.060
sft2d2a
-0.022