Daniocell
ptger4a (all cells)
prostaglandin E receptor 4 (subtype EP4) a
ZFIN
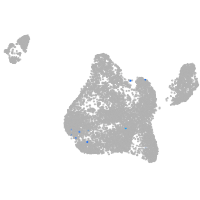
Gene expression UMAP
Display:
Expression
Stage
Other cell groups
all cells
blastomeres
PGCs
endoderm
axial mesoderm
muscle
mural cells /
non-skeletal muscle
mesenchyme
hematopoietic /
vasculature
pronephros
neural
spinal cord / glia
eye
taste / olfactory
otic / lateral line
epidermis
periderm
fin
ionocytes / mucous
pigment cells
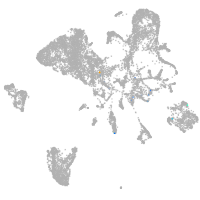
Expression by stage/cluster
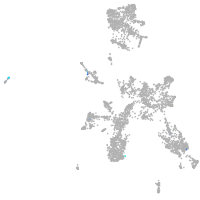
Correlated gene expression
Positive correlation
Negative correlation
Gene
r
Gene
r
si:dkey-33m11.8
0.181
gpm6aa
-0.032
fndc7a
0.162
marcksl1a
-0.031
LOC100147871
0.158
nova2
-0.029
AL954146.1
0.146
hmgb3a
-0.026
si:ch211-229d2.5
0.146
tuba1c
-0.025
fndc7b
0.141
CU467822.1
-0.024
negaly6
0.135
hmgb1b
-0.024
LOC100538032.1
0.132
CU634008.1
-0.023
LOC100536887
0.131
si:ch211-288g17.3
-0.022
CABZ01074085.1
0.130
cyt1
-0.021
moxd1l
0.127
cyt1l
-0.021
si:ch211-103f14.3
0.127
pvalb2
-0.021
si:dkeyp-110c7.4
0.126
col1a2
-0.020
cbln18
0.125
elavl3
-0.020
cbln20
0.118
fabp7a
-0.020
si:ch73-261i21.5
0.113
foxp4
-0.020
tmprss9
0.113
krtt1c19e
-0.020
si:dkey-4p15.5
0.108
nfil3-5
-0.020
urod
0.106
pvalb1
-0.020
si:dkey-205h13.2
0.105
stmn1b
-0.020
si:ch73-389b16.1
0.104
chd4a
-0.019
slc4a1a
0.100
col1a1a
-0.019
klf1
0.099
col1a1b
-0.019
hmbsb
0.096
icn2
-0.019
krt1-c5
0.096
krt4
-0.019
si:dkey-93h22.7
0.096
sox11b
-0.019
zgc:91968
0.096
zc4h2
-0.019
cd109
0.094
actc1b
-0.018
mchr2
0.094
aep1
-0.018
tyr
0.092
celf2
-0.018
gata1a
0.091
LOC798783
-0.018
hdr
0.090
mdkb
-0.018
irg1l
0.089
si:ch211-105c13.3
-0.018
mitfa
0.089
si:ch73-21g5.7
-0.018
nmt1b
0.089
tmpob
-0.018