Daniocell
nrp1b (ionocytes / mucous-producing)
neuropilin 1b
ZFIN
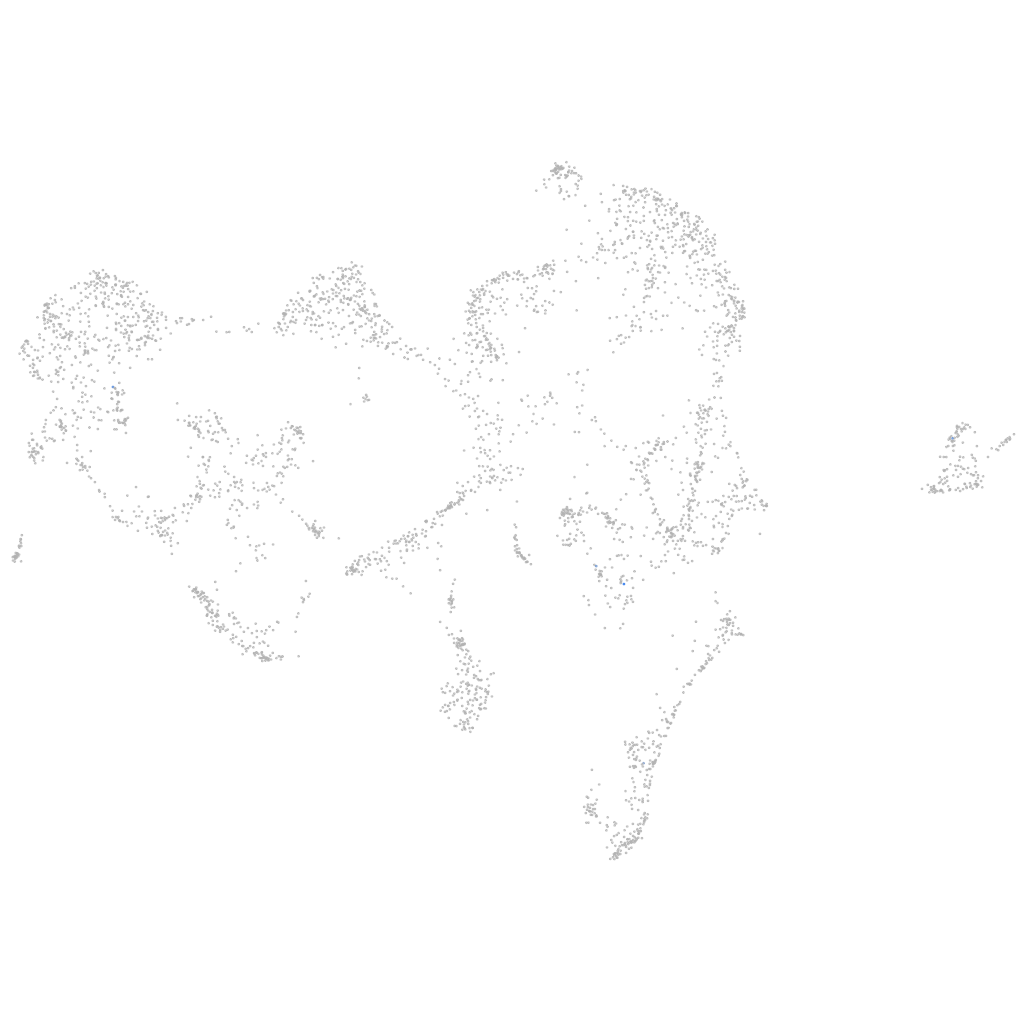
Gene expression UMAP
Display:
Expression
Stage
Other cell groups
all cells
blastomeres
PGCs
endoderm
axial mesoderm
muscle
mural cells /
non-skeletal muscle
mesenchyme
hematopoietic /
vasculature
pronephros
neural
spinal cord / glia
eye
taste / olfactory
otic / lateral line
epidermis
periderm
fin
ionocytes / mucous
pigment cells
Expression by stage/cluster
Correlated gene expression
Positive correlation
Negative correlation
Gene
r
Gene
r
XLOC-004037
0.617
cldnh
-0.036
sele
0.570
epcam
-0.034
hhex
0.438
fabp3
-0.033
XLOC-043665
0.421
jun
-0.031
LOC101885981
0.411
icn
-0.029
LOC101882826
0.397
zgc:153911
-0.029
tal1
0.369
si:dkey-87o1.2
-0.028
tbxta
0.362
spint2
-0.028
egfl7
0.354
znf185
-0.026
adprhl1
0.350
sgk2a
-0.026
mkxb
0.347
si:ch211-270g19.5
-0.025
CABZ01068352.1
0.347
ak1
-0.025
grifin
0.340
nfe2l2a
-0.025
wfikkn1
0.318
si:ch211-162e15.3
-0.024
lmo2
0.315
ftr83
-0.024
LOC110438108
0.313
nipal4
-0.024
CABZ01012885.1
0.307
zgc:101744
-0.023
CU682811.1
0.305
gbgt1l4
-0.023
LOC101886291
0.304
cldnb
-0.023
fbln1
0.289
tnks1bp1
-0.023
si:ch211-136a13.1
0.287
krt17
-0.023
prex1
0.277
stat1a
-0.023
etv2
0.271
si:ch73-31d8.2
-0.023
tpcn3
0.268
bik
-0.022
parvab
0.264
pvalb2
-0.022
XLOC-016199
0.263
elf3
-0.022
CU469420.4
0.254
eppk1
-0.022
si:dkey-9i23.14
0.251
tuft1a
-0.022
zgc:195023
0.248
zgc:158463
-0.022
mespaa
0.243
sypl2a
-0.022
omd
0.241
b2ml
-0.022
hoxc12a
0.241
grhl1
-0.022
LOC100534765
0.239
krt4
-0.022
thsd1
0.229
si:ch73-91k6.2
-0.022
BX901962.3
0.226
egr2a
-0.021