Daniocell
nrp1b (pronephros)
neuropilin 1b
ZFIN
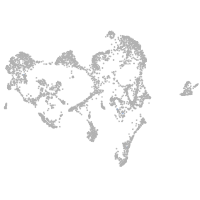
Gene expression UMAP
Display:
Expression
Stage
Other cell groups
all cells
blastomeres
PGCs
endoderm
axial mesoderm
muscle
mural cells /
non-skeletal muscle
mesenchyme
hematopoietic /
vasculature
pronephros
neural
spinal cord / glia
eye
taste / olfactory
otic / lateral line
epidermis
periderm
fin
ionocytes / mucous
pigment cells
Expression by stage/cluster
Correlated gene expression
Positive correlation
Negative correlation
Gene
r
Gene
r
SLCO3A1 (1 of many)
0.347
idh2
-0.110
LOC110437908
0.341
atp5mc1
-0.101
BX942846.1
0.325
si:ch211-139a5.9
-0.100
si:ch73-68b22.2
0.315
atp5f1b
-0.098
BX890559.1
0.312
cox6b1
-0.095
CR854838.1
0.312
gstp1
-0.093
CABZ01078350.1
0.309
zgc:193541
-0.093
si:ch211-59d15.4
0.302
atp1a1a.4
-0.092
CR339054.2
0.300
cox5ab
-0.091
BX663611.1
0.296
si:dkey-16p21.8
-0.090
CABZ01071939.1
0.290
aldh6a1
-0.090
CR388129.1
0.279
ldhba
-0.089
SYNDIG1
0.279
suclg1
-0.089
LOC110437985
0.275
eno3
-0.086
porcn
0.272
sdhdb
-0.086
CABZ01117752.1
0.267
echs1
-0.085
zgc:153395
0.267
cox6a2
-0.085
XLOC-023369
0.266
aldh9a1a.1
-0.085
vps72b
0.265
chchd10
-0.085
BX000701.1
0.261
aldh7a1
-0.084
crfb2
0.259
mdh2
-0.084
wasf1
0.258
actb2
-0.084
LRRC75A
0.251
ahcyl1
-0.084
ndst1a
0.251
sod2
-0.084
cntnap3
0.249
ppifb
-0.084
si:ch211-106h4.9
0.245
eif4a1b
-0.083
alg13
0.240
mt-nd4
-0.083
CT573408.1
0.240
cdaa
-0.082
LOC110437767
0.240
ndrg1a
-0.082
v2rc1
0.240
hibadhb
-0.082
si:dkey-175m17.7
0.238
cox7b
-0.081
LOC101885985
0.235
slc25a5
-0.081
cd83
0.232
etfa
-0.081
faxca
0.231
ndufb4
-0.080
apoba
0.229
atp5l
-0.080