Daniocell
nrp1b (fin)
neuropilin 1b
ZFIN
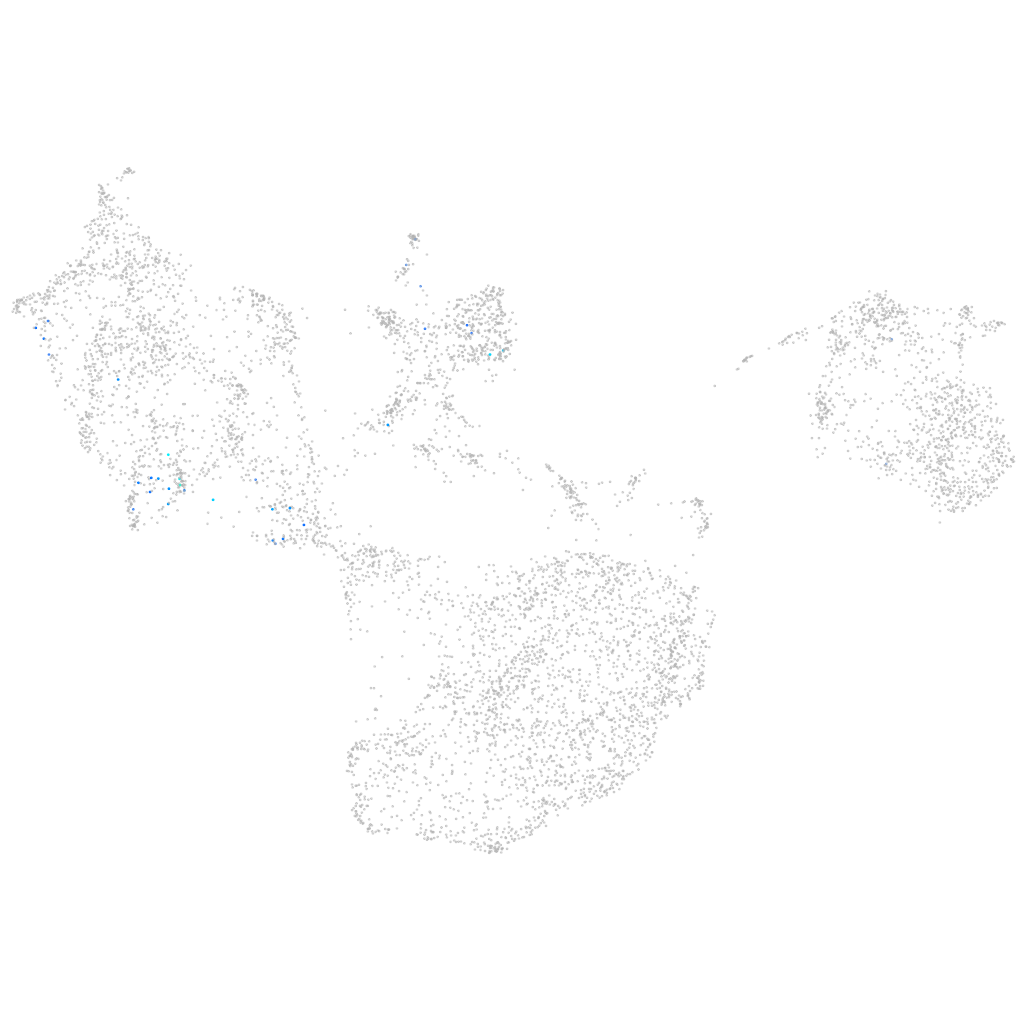
Gene expression UMAP
Display:
Expression
Stage
Other cell groups
all cells
blastomeres
PGCs
endoderm
axial mesoderm
muscle
mural cells /
non-skeletal muscle
mesenchyme
hematopoietic /
vasculature
pronephros
neural
spinal cord / glia
eye
taste / olfactory
otic / lateral line
epidermis
periderm
fin
ionocytes / mucous
pigment cells
Expression by stage/cluster
Correlated gene expression
Positive correlation
Negative correlation
Gene
r
Gene
r
gprin1
0.339
and2
-0.083
CU633855.1
0.266
tmsb1
-0.072
LOC108180805
0.266
cfl1l
-0.071
XLOC-024706
0.255
aqp3a
-0.071
LOC108179735
0.245
cldni
-0.070
si:dkey-57c15.1
0.245
epcam
-0.070
si:dkey-33m11.8
0.239
and1
-0.069
b4galnt1b
0.229
pfn1
-0.066
LOC108191476
0.224
cldn1
-0.066
si:dkeyp-86c4.1
0.217
s100a10b
-0.065
LOC103911264
0.210
anxa1a
-0.065
si:dkey-254e13.6
0.201
cyt1
-0.064
CU062628.1
0.195
dnase1l4.1
-0.063
adcy1a
0.190
krt4
-0.063
cpne5a
0.188
myh9a
-0.062
dnajb13
0.188
spaca4l
-0.062
BX569796.1
0.187
ecrg4b
-0.061
BX322657.3
0.187
rac2
-0.061
CABZ01080599.1
0.185
si:dkey-248g15.3
-0.060
rspo3
0.177
cotl1
-0.060
vsig10l
0.168
cebpb
-0.059
dcc
0.164
si:dkey-102c8.3
-0.058
XLOC-039021
0.164
tagln2
-0.058
LOC103911922
0.162
rbp4
-0.058
dnase1
0.161
zgc:92380
-0.057
foxd2
0.161
hbegfa
-0.057
eomesb
0.158
zgc:86896
-0.056
si:dkey-33c12.12
0.154
arhgef5
-0.056
msh4
0.153
egfl6
-0.055
TULP1
0.153
apoeb
-0.055
adam8a
0.152
selenow1
-0.055
trhde.2
0.150
dlx3b
-0.054
artnb
0.150
krt5
-0.054
RF00133
0.148
col1a1a
-0.054
ebf2
0.148
tmem238a
-0.054