Daniocell
nfixb (ionocytes / mucous-producing)
nuclear factor I/Xb
ZFIN
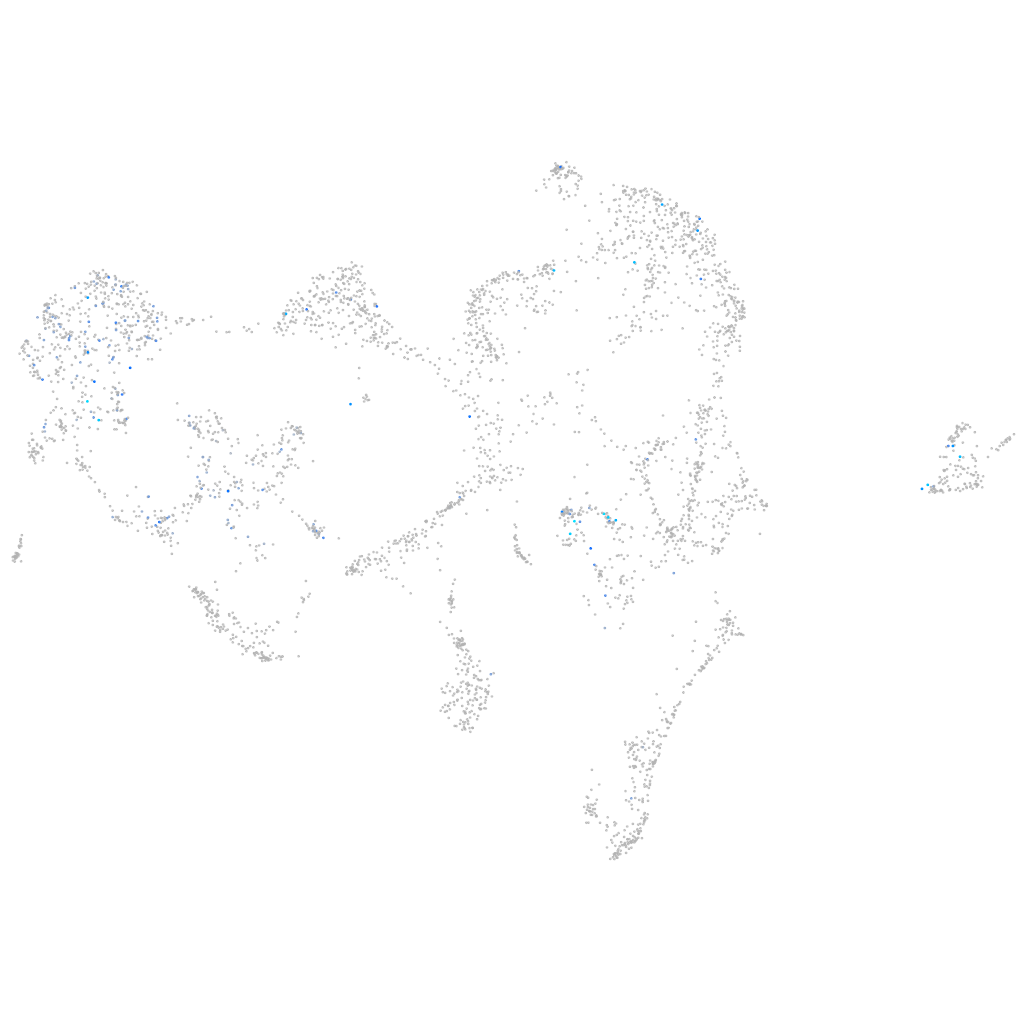
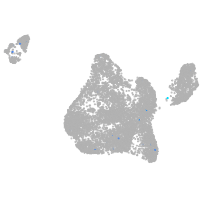
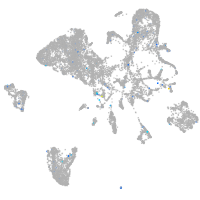
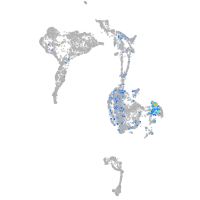
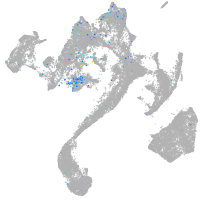
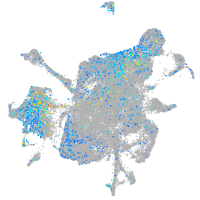
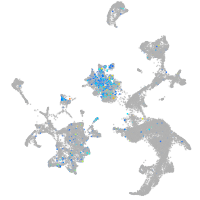
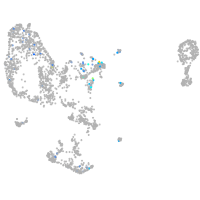
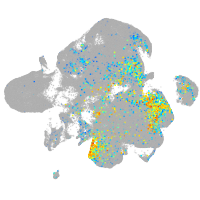
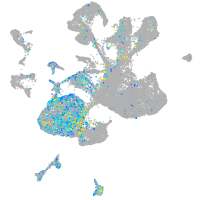
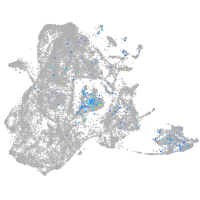
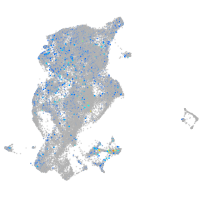
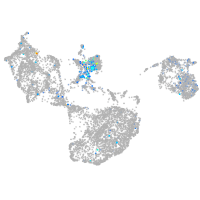
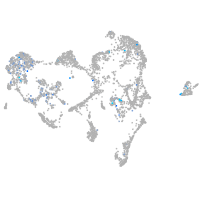
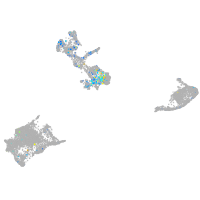
Gene expression UMAP
Display:
Expression
Stage
Other cell groups
all cells
blastomeres
PGCs
endoderm
axial mesoderm
muscle
mural cells /
non-skeletal muscle
mesenchyme
hematopoietic /
vasculature
pronephros
neural
spinal cord / glia
eye
taste / olfactory
otic / lateral line
epidermis
periderm
fin
ionocytes / mucous
pigment cells
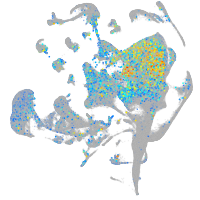
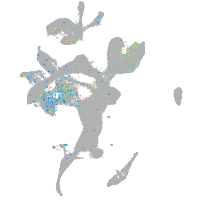
Expression by stage/cluster
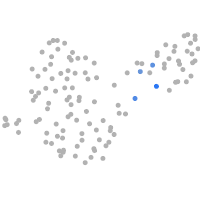
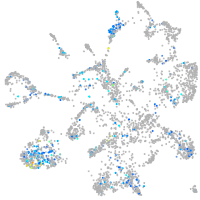
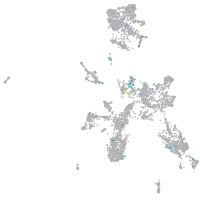
Correlated gene expression
Positive correlation
Negative correlation
Gene
r
Gene
r
LOC110439967
0.214
dnase1l4.1
-0.078
nfia
0.214
capn8
-0.064
map3k9
0.205
cldnh
-0.064
si:ch211-22d5.2
0.201
phb2b
-0.063
BX649490.4
0.198
ap1s3b
-0.062
LOC108192077
0.198
anxa11b
-0.061
LOC108192083
0.198
myb
-0.061
pcdh2ab9
0.198
s100u
-0.060
LOC103909284
0.196
rab5if
-0.060
LOC103911111
0.190
krt8
-0.059
pcdhb
0.190
si:dkey-44g23.5
-0.058
grm5b
0.190
copz2
-0.057
npy
0.184
mrpl45
-0.057
spp1
0.183
histh1l
-0.057
si:dkeyp-50b9.1
0.183
phb
-0.057
CR790388.2
0.183
krt18a.1
-0.056
gpr101
0.183
fabp3
-0.054
LO018260.2
0.183
zgc:193541
-0.054
tal2
0.182
myl12.2
-0.052
si:ch211-106n13.3
0.180
hspd1
-0.052
col5a2b
0.180
mat2al
-0.051
znf219
0.179
agrp
-0.051
panx3
0.177
sdf2l1
-0.051
LOC103909513
0.176
tma7
-0.051
BX284697.2
0.176
mrpl47
-0.051
si:dkey-1b17.1
0.176
zgc:165573
-0.050
col10a1b
0.175
scinla
-0.050
neurod6b
0.174
si:dkeyp-72e1.7
-0.050
mamdc2b
0.173
hccsb
-0.050
CACNA2D1
0.170
mrps24
-0.050
LOC100332187
0.167
zgc:92380
-0.049
bgna
0.165
foxi3a
-0.049
crabp1a
0.163
gcm2
-0.049
sox1a
0.162
gale
-0.048
LOC108191313
0.161
rhbdl2
-0.048