Daniocell
nek9 (endoderm)
NIMA related kinase 9
ZFIN
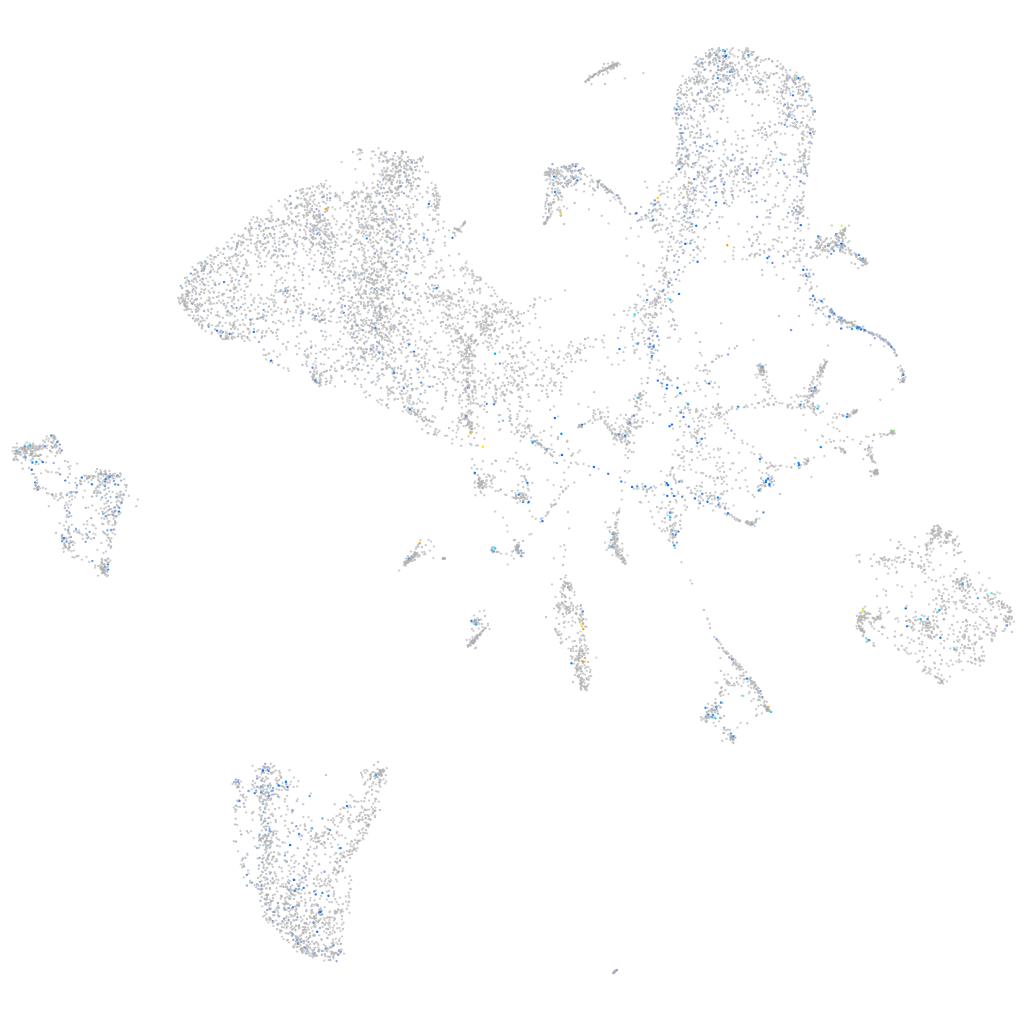
Gene expression UMAP
Display:
Expression
Stage
Other cell groups
all cells
blastomeres
PGCs
endoderm
axial mesoderm
muscle
mural cells /
non-skeletal muscle
mesenchyme
hematopoietic /
vasculature
pronephros
neural
spinal cord / glia
eye
taste / olfactory
otic / lateral line
epidermis
periderm
fin
ionocytes / mucous
pigment cells
Expression by stage/cluster
Correlated gene expression
Positive correlation
Negative correlation
Gene
r
Gene
r
BX088596.1
0.127
apoc1
-0.090
LOC100534675
0.126
apom
-0.081
cbln6
0.125
fabp10a
-0.081
XLOC-039631
0.122
zgc:123103
-0.079
ccdc169
0.119
rbp2b
-0.078
LOC103909581
0.119
serpina1l
-0.077
LOC103911313
0.118
serpina1
-0.076
slbp2
0.115
apoa2
-0.076
sult1st7
0.111
ttr
-0.076
zgc:172302
0.110
ces2
-0.076
gnrh3
0.105
ambp
-0.074
cx32.2
0.103
hpda
-0.073
si:ch1073-268j14.1
0.100
si:dkey-86l18.10
-0.073
LOC101882128
0.100
fgg
-0.072
LOC108191529
0.099
grhprb
-0.072
XLOC-014193
0.099
LOC110437731
-0.072
pfn2
0.099
uox
-0.072
xgb
0.097
gc
-0.072
BX649628.1
0.097
agxtb
-0.072
zgc:171497
0.096
tfa
-0.071
si:dkeyp-80d11.4
0.095
apoa1b
-0.071
si:dkey-54j5.2
0.094
rbp4
-0.071
LOC103910762
0.092
hao1
-0.071
smpd1
0.092
comtd1
-0.069
amotl2b
0.090
bhmt
-0.069
LOC101885980
0.089
fetub
-0.069
si:dkey-202b22.5
0.089
fgb
-0.068
LOC795962
0.089
c9
-0.068
or106-6
0.089
pygl
-0.068
XLOC-007246
0.088
shbg
-0.068
perp
0.088
f7i
-0.067
arsa
0.087
si:ch73-281k2.5
-0.067
CABZ01079480.1
0.087
sec14l7
-0.067
si:ch73-61d6.3
0.086
cdab
-0.067
BX571707.1
0.086
igfbp2a
-0.066