Daniocell
nek9 (taste / olfactory)
NIMA related kinase 9
ZFIN
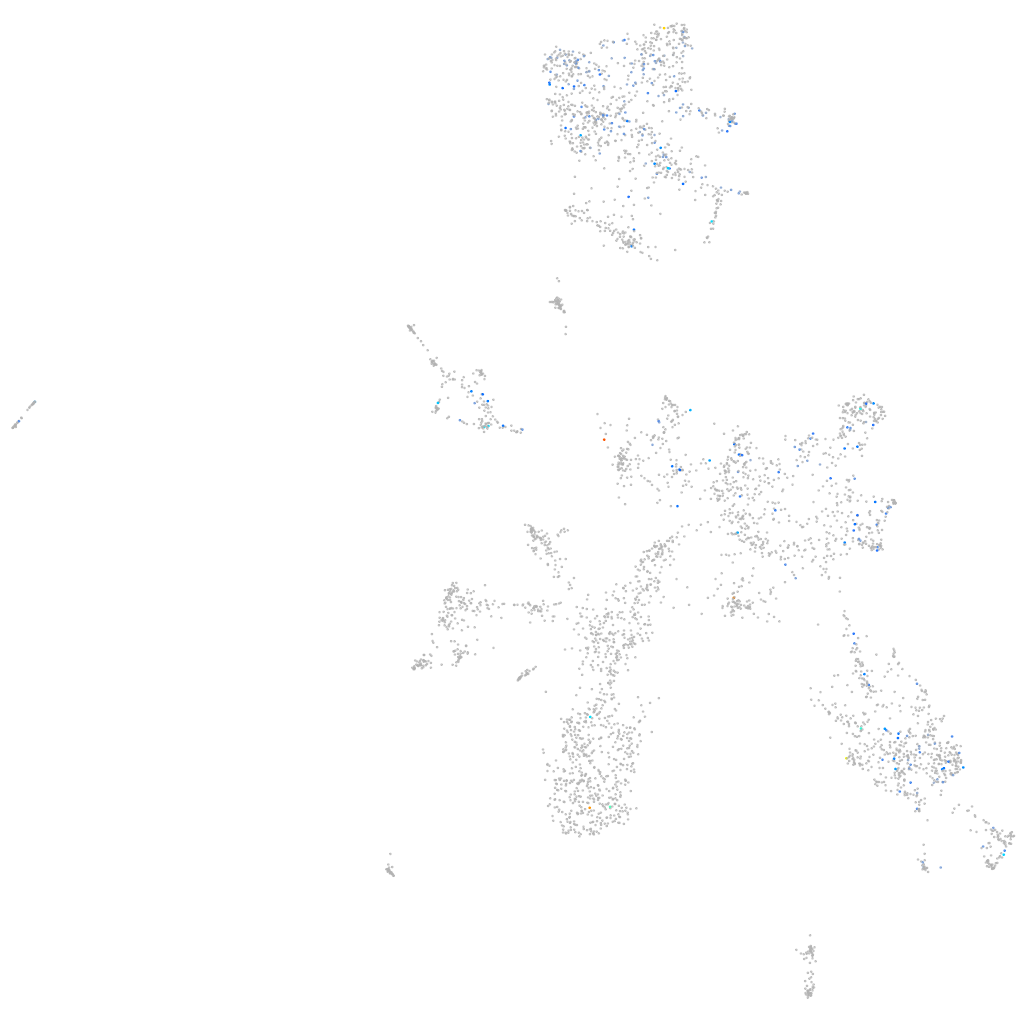
Gene expression UMAP
Display:
Expression
Stage
Other cell groups
all cells
blastomeres
PGCs
endoderm
axial mesoderm
muscle
mural cells /
non-skeletal muscle
mesenchyme
hematopoietic /
vasculature
pronephros
neural
spinal cord / glia
eye
taste / olfactory
otic / lateral line
epidermis
periderm
fin
ionocytes / mucous
pigment cells
Expression by stage/cluster
Correlated gene expression
Positive correlation
Negative correlation
Gene
r
Gene
r
LOC110439855
0.285
stmn1b
-0.112
tdrd5
0.271
rtn1a
-0.107
lim2.5
0.214
tspan2a
-0.104
si:ch211-256e16.6
0.200
insm1a
-0.098
si:dkey-246j6.3
0.191
elavl3
-0.096
LOC108179633
0.190
sncb
-0.095
pnck
0.189
rnasekb
-0.089
slc7a2
0.184
gng3
-0.089
prkn
0.177
si:ch211-10a23.2
-0.087
il15l
0.176
fthl31
-0.087
si:dkey-250k15.4
0.174
si:dkeyp-75h12.5
-0.086
hdc
0.170
atp6v0cb
-0.086
zbtb25
0.167
LOC100537342
-0.083
si:ch211-106h4.9
0.165
tmeff1b
-0.082
LOC108179300
0.159
scg2b
-0.082
si:dkey-94e7.2
0.159
rasd3
-0.082
hoxb6b
0.158
atpv0e2
-0.081
si:ch211-276i6.1
0.150
cnrip1a
-0.079
si:ch73-233f7.1
0.148
atp2b1a
-0.079
znf1003
0.145
map1b
-0.077
BX004991.1
0.143
fstl5
-0.077
il13ra1
0.142
si:dkey-276j7.1
-0.076
si:ch211-226h8.15
0.139
pvalb5
-0.076
ppip5k1b
0.138
olfm1b
-0.076
sowahaa
0.135
vdac3
-0.076
myo1ca
0.134
stxbp1a
-0.076
XLOC-018367
0.134
dnajc5aa
-0.076
si:ch211-236k19.2
0.132
tnrc6c1
-0.075
pex2
0.131
gnao1b
-0.075
enc2
0.128
syt11a
-0.075
ighd
0.127
adcyap1b
-0.074
CU468917.1
0.122
si:ch211-237l4.6
-0.074
CABZ01079267.1
0.121
lhx2b
-0.073
LOC110439571
0.120
zgc:65894
-0.073
CU459056.2
0.119
calm2a
-0.072