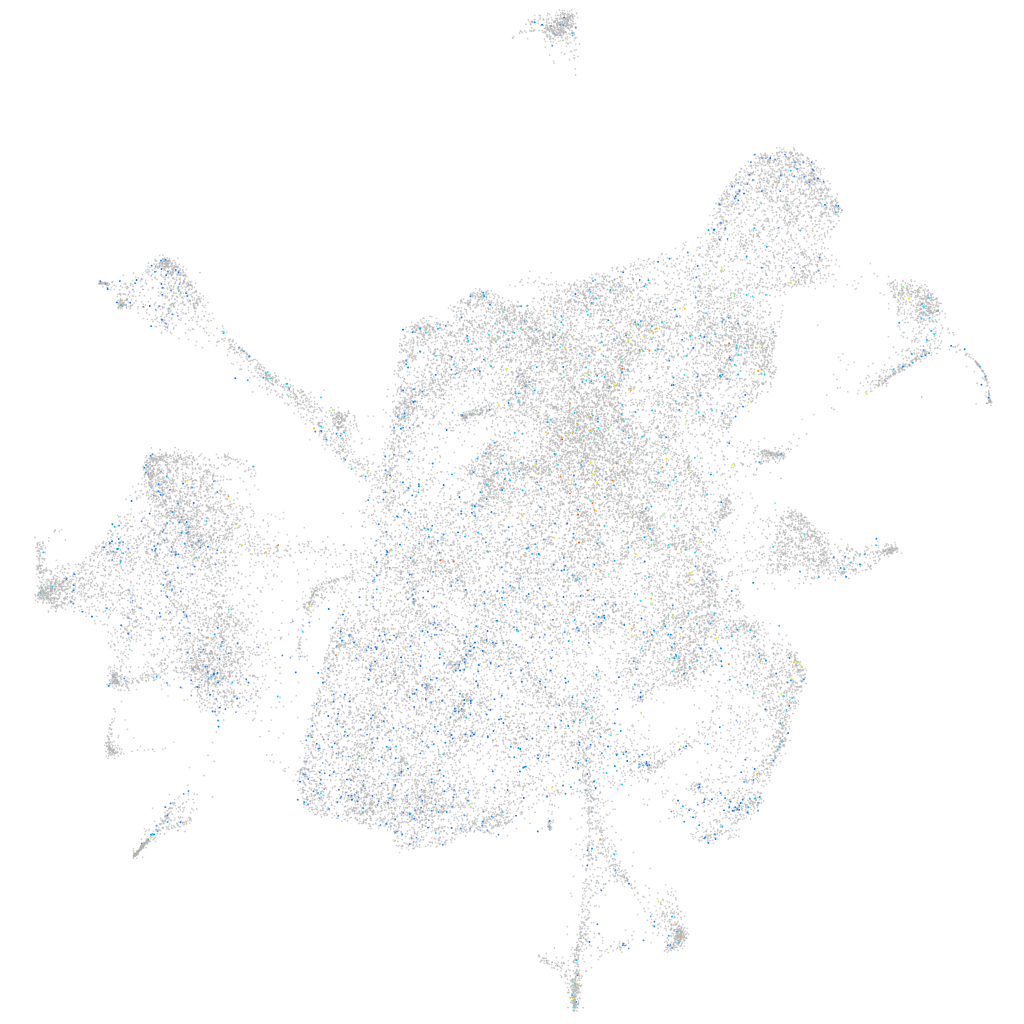
Daniocell
nek9 (mesenchyme)
NIMA related kinase 9
ZFIN
Gene expression UMAP
Display:
Expression
Stage
Other cell groups
all cells
blastomeres
PGCs
endoderm
axial mesoderm
muscle
mural cells /
non-skeletal muscle
mesenchyme
hematopoietic /
vasculature
pronephros
neural
spinal cord / glia
eye
taste / olfactory
otic / lateral line
epidermis
periderm
fin
ionocytes / mucous
pigment cells
Expression by stage/cluster
Correlated gene expression
Positive correlation
Negative correlation
Gene
r
Gene
r
BX547939.1
0.054
vwde
-0.019
si:ch73-378g22.1
0.048
pvalb2
-0.018
CU855917.1
0.047
rtn1a
-0.018
kcna10a
0.047
stmn1b
-0.016
wu:fb63a08
0.047
nova2
-0.016
XLOC-026839
0.047
ckbb
-0.015
LOC110439481
0.046
mylpfa
-0.015
si:cabz01090193.1
0.044
myt1b
-0.014
XLOC-025278
0.041
add2
-0.014
cnga2a
0.040
tnni2a.4
-0.014
LOC103911264
0.040
tmed4
-0.014
LOC110438242
0.039
otos
-0.014
ctxn2
0.037
elavl3
-0.014
LOC101882257.1
0.037
p4hb
-0.014
dand5
0.037
pvalb1
-0.014
XLOC-009786
0.037
mylpfb
-0.014
XLOC-039966
0.036
ppp1r14c
-0.014
vwa10.2
0.036
fkbp11
-0.014
LOC110439009
0.035
kif1aa
-0.014
CR394552.1
0.035
actc1b
-0.013
BX248122.1
0.034
map4l
-0.013
crhr2.1
0.034
mycb
-0.013
sik2a
0.033
CU467822.1
-0.013
LOC108179500
0.032
ckma
-0.013
si:dkey-65b12.10
0.032
ppp1r14ba
-0.013
zgc:162183
0.032
rtn1b
-0.013
FP016213.1
0.031
cdh4
-0.013
XLOC-005580
0.031
PRKAR2B
-0.013
nlrb5
0.030
rims2a
-0.013
grid2ipa
0.030
mllt11
-0.012
CU855758.2
0.030
gnao1a
-0.012
si:dkey-74h17.3
0.029
islr2
-0.012
BX927394.3
0.029
rnasekb
-0.012
CR944667.3
0.029
camk2d2
-0.012
znf1046
0.029
otx2b
-0.012