Daniocell
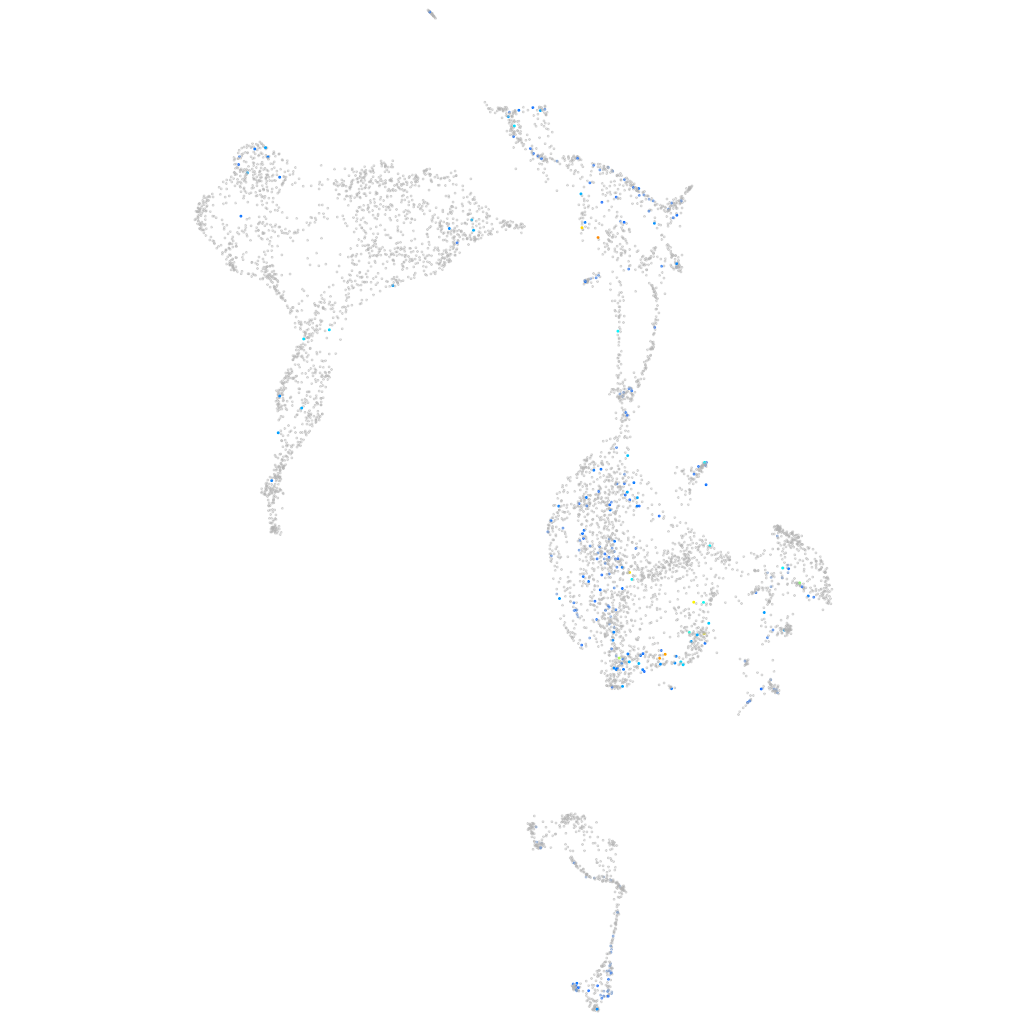
nek9 (axial mesoderm)
NIMA related kinase 9
ZFIN
Gene expression UMAP
Display:
Expression
Stage
Other cell groups
all cells
blastomeres
PGCs
endoderm
axial mesoderm
muscle
mural cells /
non-skeletal muscle
mesenchyme
hematopoietic /
vasculature
pronephros
neural
spinal cord / glia
eye
taste / olfactory
otic / lateral line
epidermis
periderm
fin
ionocytes / mucous
pigment cells
Expression by stage/cluster
Correlated gene expression
Positive correlation
Negative correlation
Gene
r
Gene
r
taar16g
0.207
marcksb
-0.094
msnb
0.188
hmga1a
-0.092
mkrn2os.2
0.186
si:ch73-1a9.3
-0.089
LOC110440198
0.170
fbl
-0.089
LOC110439493
0.153
dkc1
-0.089
UST (1 of many)
0.151
npm1a
-0.088
cttnbp2nla
0.132
rbm4.3
-0.088
si:ch211-63b16.4
0.128
hnrnpa1b
-0.088
XLOC-022611
0.128
nop58
-0.085
rnf151
0.125
NC-002333.4
-0.084
XLOC-019674
0.124
hnrnpub
-0.084
LOC110439478
0.122
hspb1
-0.084
si:dkeyp-2e4.5
0.121
hnrnpabb
-0.084
LOC103912066
0.120
syncrip
-0.083
chrna1
0.112
nucks1a
-0.083
trpm3
0.111
nop56
-0.082
XLOC-021899
0.111
hnrnpm
-0.082
CR383668.2
0.110
ilf3b
-0.081
si:dkey-174i8.1
0.110
hnrnpa1a
-0.081
cd302
0.110
safb
-0.081
LOC108179993
0.109
anp32e
-0.081
LOC110439332
0.109
snrpa
-0.079
dap1b
0.109
hnrnpaba
-0.079
abcc6a
0.108
anp32b
-0.079
fabp6
0.107
seta
-0.079
eomesb
0.107
banf1
-0.078
fbxl17
0.107
marcksl1b
-0.078
enpp1
0.107
stm
-0.078
znf972
0.106
srp19
-0.077
BX649355.1
0.105
setb
-0.077
rinl
0.104
snrpd3l
-0.077
CT583728.24
0.102
snrpc
-0.077
si:dkey-1j5.4
0.102
snrpb
-0.077
si:dkey-6n6.1
0.101
ddx39aa
-0.077
lmo7a
0.101
ddx18
-0.076