Daniocell
mars2 (muscle)
"methionyl-tRNA synthetase 2, mitochondrial"
ZFIN
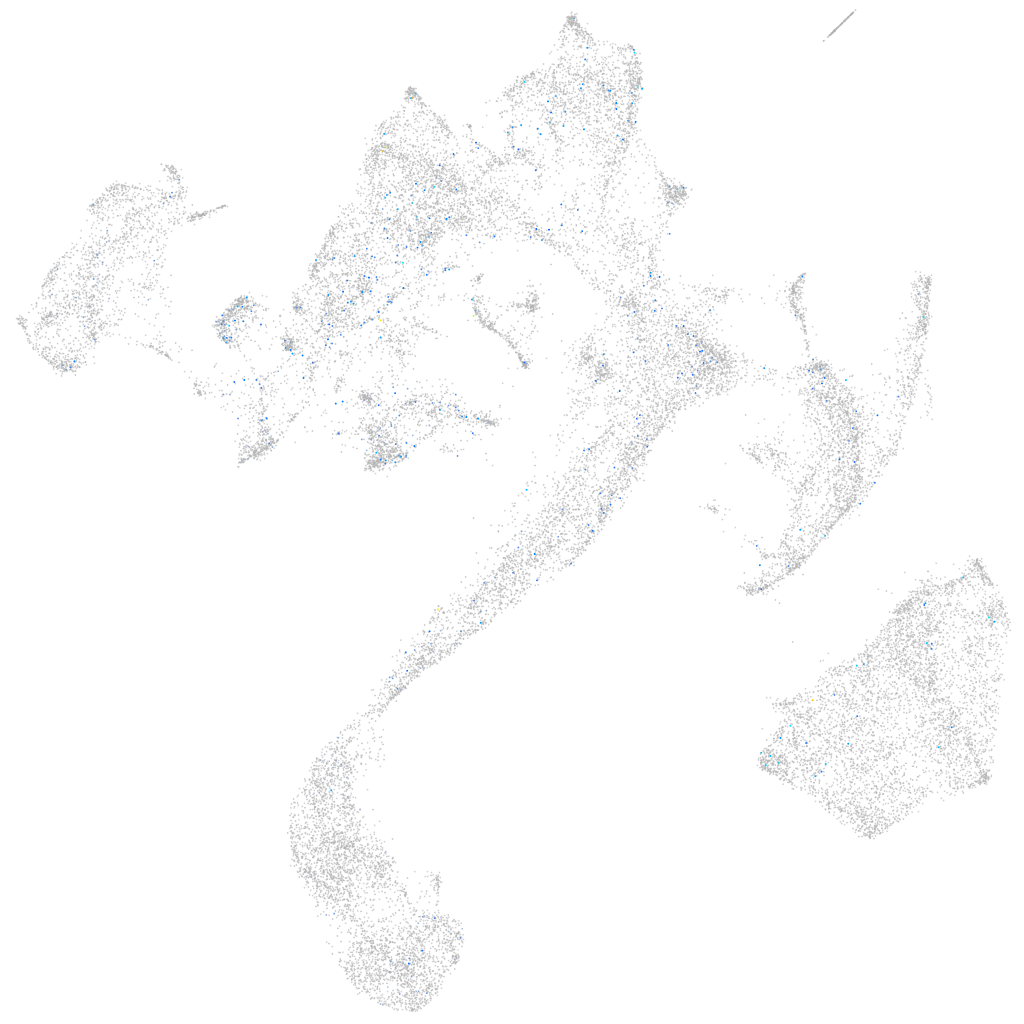
Gene expression UMAP
Display:
Expression
Stage
Other cell groups
all cells
blastomeres
PGCs
endoderm
axial mesoderm
muscle
mural cells /
non-skeletal muscle
mesenchyme
hematopoietic /
vasculature
pronephros
neural
spinal cord / glia
eye
taste / olfactory
otic / lateral line
epidermis
periderm
fin
ionocytes / mucous
pigment cells
Expression by stage/cluster
Correlated gene expression
Positive correlation
Negative correlation
Gene
r
Gene
r
nitr7b
0.087
tbx16
-0.035
si:dkey-22f5.9
0.083
hspb1
-0.034
XLOC-012822
0.081
im:7138239
-0.032
CR790362.1
0.078
apoc1
-0.031
gmip
0.074
msgn1
-0.031
CR854948.1
0.073
cdx4
-0.030
si:dkeyp-80d11.1
0.072
stm
-0.029
tuba8l3
0.068
ved
-0.029
znf1034
0.068
rbm38
-0.029
nitr7a
0.067
apoeb
-0.029
si:ch211-193l2.10
0.066
hes6
-0.028
CR855860.1
0.065
vox
-0.028
slc38a5a
0.064
efnb2b
-0.028
LOC110439978
0.063
tbxta
-0.027
XLOC-002688
0.062
si:ch211-152c2.3
-0.027
pla2g1b
0.061
tob1a
-0.027
si:ch211-156p11.1
0.061
cdx1a
-0.027
tunar
0.061
her7
-0.027
BX663521.1
0.061
BX927258.1
-0.026
LOC101882128
0.060
s100a1
-0.026
vap
0.058
aldoaa
-0.026
nme2b.1
0.056
XLOC-005350
-0.026
slitrk5b
0.056
sp5l
-0.026
kcnc3b
0.055
tuba8l2
-0.025
elfn2a
0.054
foxd5
-0.025
sned1
0.053
wnt11f2
-0.025
XLOC-037922
0.053
add3b
-0.025
BX248410.1
0.051
XLOC-001975
-0.024
ppiab
0.051
tpbga
-0.024
FQ311924.2
0.050
XLOC-030027
-0.024
hdc
0.048
CR855257.1
-0.023
LOC103911903
0.047
LOC100008030
-0.023
aqp8a.2
0.047
cmtm6
-0.023
prdx2
0.047
tmem136a
-0.023
atp1a1a.2
0.047
wnt5b
-0.023