Daniocell
mars2 (periderm)
"methionyl-tRNA synthetase 2, mitochondrial"
ZFIN
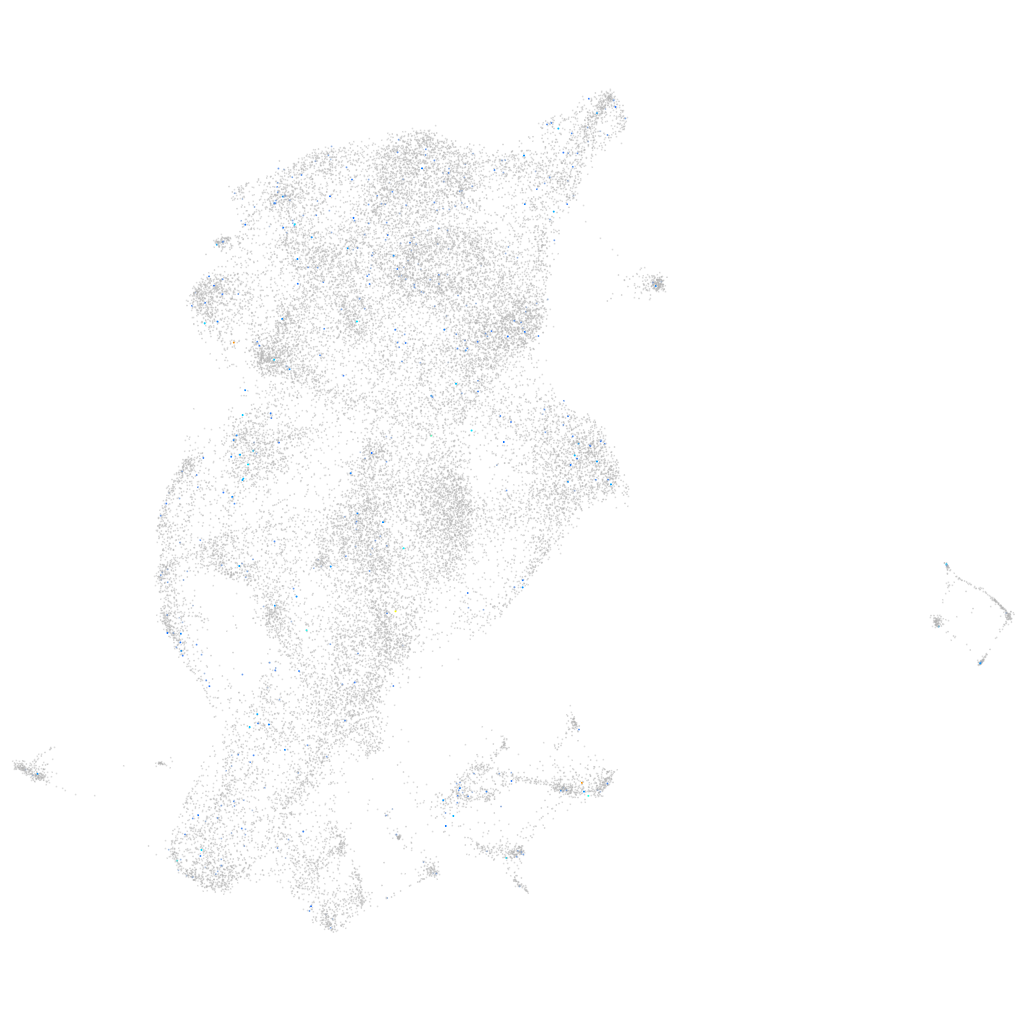
Gene expression UMAP
Display:
Expression
Stage
Other cell groups
all cells
blastomeres
PGCs
endoderm
axial mesoderm
muscle
mural cells /
non-skeletal muscle
mesenchyme
hematopoietic /
vasculature
pronephros
neural
spinal cord / glia
eye
taste / olfactory
otic / lateral line
epidermis
periderm
fin
ionocytes / mucous
pigment cells
Expression by stage/cluster
Correlated gene expression
Positive correlation
Negative correlation
Gene
r
Gene
r
LOC110439549
0.196
krt4
-0.036
LOC110438006
0.135
cyt1
-0.033
si:dkey-23f9.12
0.110
zgc:193505
-0.029
citb
0.101
cyt1l
-0.026
si:dkey-222h21.9
0.096
icn
-0.026
AL953896.1
0.095
wu:fb18f06
-0.026
ccdc73
0.095
icn2
-0.026
si:ch211-241b2.4
0.094
anxa1c
-0.020
FO704648.2
0.093
agr1
-0.019
myo7ab
0.093
ponzr3
-0.017
nme8
0.086
CR854839.1
-0.016
LOC110439337
0.085
si:dkey-16p21.8
-0.016
BX324164.5
0.085
si:ch211-195b11.3
-0.016
CR589944.3
0.085
krt5
-0.016
si:ch73-138e16.5
0.084
ponzr4
-0.015
lrrc73
0.084
LOC101883443
-0.014
mir221
0.084
aep1
-0.014
LOC103908741
0.081
fam222ba
-0.014
TCIM
0.079
s100a10b
-0.013
CU633479.5
0.076
cfl1l
-0.013
sim1b
0.075
CT583728.23
-0.013
zbtb47b
0.075
alox12
-0.013
si:ch211-218h8.3
0.074
ost4
-0.013
BX005414.1
0.073
actb2
-0.012
syt9a
0.072
capns1b
-0.012
LOC570185
0.072
hbae3
-0.012
XLOC-008602
0.072
hbae1.3
-0.011
rnf135
0.072
XLOC-041945
-0.011
LOC103911035
0.070
hbbe1.1
-0.011
rad21b
0.070
selenow1
-0.011
si:ch211-165f21.7
0.069
map3k5
-0.011
SLC15A5
0.068
XLOC-035413
-0.011
rprma
0.068
tpma
-0.011
gjd1a
0.067
krtt1c19e
-0.011
drd2a
0.064
cav2
-0.011