Daniocell
mars2 (fin)
"methionyl-tRNA synthetase 2, mitochondrial"
ZFIN
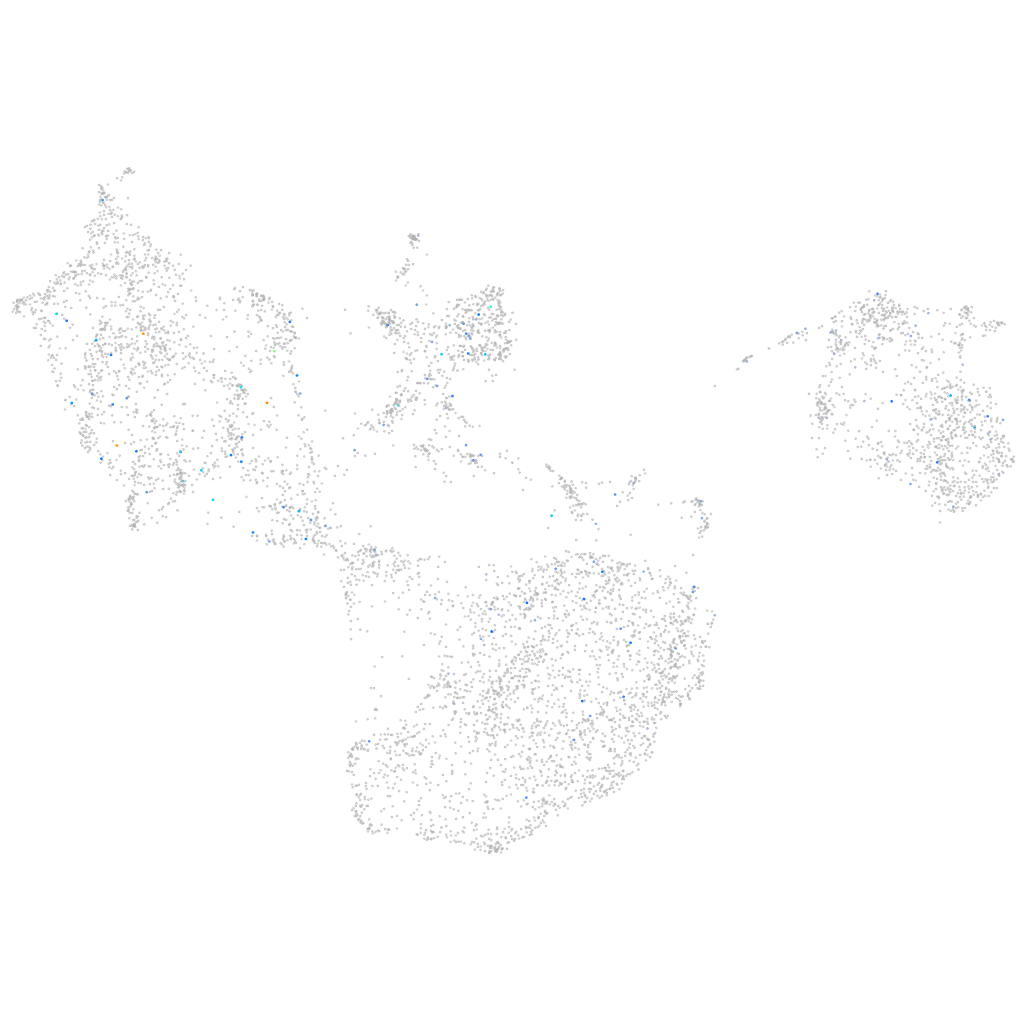
Gene expression UMAP
Display:
Expression
Stage
Other cell groups
all cells
blastomeres
PGCs
endoderm
axial mesoderm
muscle
mural cells /
non-skeletal muscle
mesenchyme
hematopoietic /
vasculature
pronephros
neural
spinal cord / glia
eye
taste / olfactory
otic / lateral line
epidermis
periderm
fin
ionocytes / mucous
pigment cells
Expression by stage/cluster
Correlated gene expression
Positive correlation
Negative correlation
Gene
r
Gene
r
galnt8b.1
0.209
ier2b
-0.052
si:cabz01069013.3
0.200
si:dkey-102c8.3
-0.050
smyd1b
0.197
cap1
-0.049
si:ch211-168b3.2
0.186
cebpd
-0.046
LOC108190604
0.174
epcam
-0.046
zgc:158296
0.158
cfl1l
-0.046
prkd1
0.148
cldni
-0.046
si:ch211-255a21.2
0.147
s100a10b
-0.046
lrp1ba
0.146
egfl6
-0.045
AL929396.1
0.145
apoeb
-0.045
XLOC-039714
0.143
tmsb1
-0.045
htr1fb
0.142
fras1
-0.045
si:dkey-246g23.4
0.136
aqp3a
-0.045
LOC110438077
0.134
cldn1
-0.044
LOC101884528
0.133
tmsb4x
-0.044
LOC110440109
0.130
cotl1
-0.042
LOC100008030
0.129
lama5
-0.042
KCNJ15
0.124
lgals3b
-0.042
znf438
0.123
spaca4l
-0.042
XLOC-010908
0.123
ca6
-0.041
p2rx5
0.123
thy1
-0.041
rad9a
0.118
tagln2
-0.041
LOC569391
0.117
pfn1
-0.041
CABZ01055707.1
0.116
sp8a
-0.041
crb1
0.115
col18a1a
-0.041
dnajb13
0.113
bcam
-0.040
TULP1
0.111
s100v2
-0.039
slc22a17
0.111
frem2a
-0.039
mb21d2
0.111
btg2
-0.039
si:ch73-40a17.3
0.110
rbp4
-0.039
zmp:0000000634
0.109
and3
-0.039
TM4SF19
0.109
si:dkey-248g15.3
-0.038
kcnk9
0.109
sp6
-0.038
LOC101884995
0.105
sp9
-0.038
CR933734.2
0.105
myh9a
-0.038