Daniocell
mars2 (glial cells / spinal cord)
"methionyl-tRNA synthetase 2, mitochondrial"
ZFIN
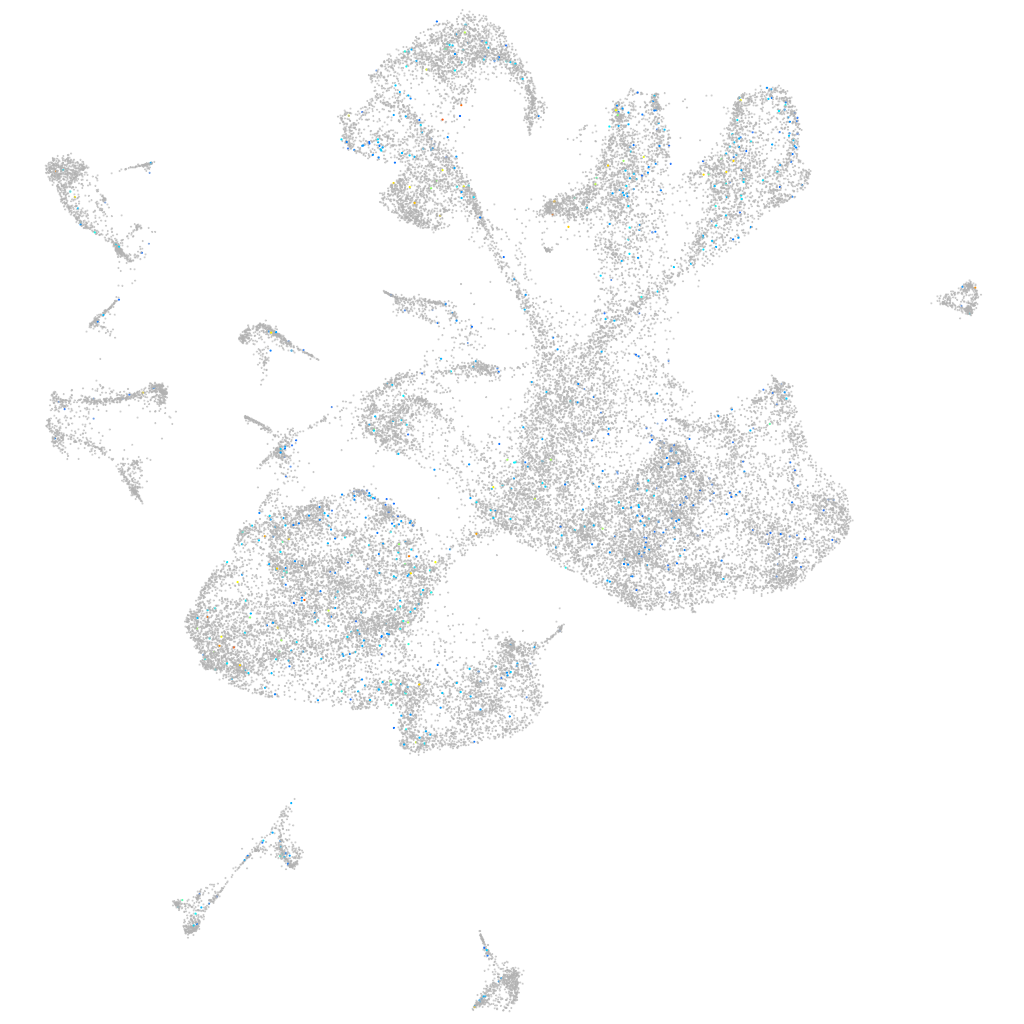
Gene expression UMAP
Display:
Expression
Stage
Other cell groups
all cells
blastomeres
PGCs
endoderm
axial mesoderm
muscle
mural cells /
non-skeletal muscle
mesenchyme
hematopoietic /
vasculature
pronephros
neural
spinal cord / glia
eye
taste / olfactory
otic / lateral line
epidermis
periderm
fin
ionocytes / mucous
pigment cells
Expression by stage/cluster
Correlated gene expression
Positive correlation
Negative correlation
Gene
r
Gene
r
lgsn
0.066
ldlrad2
-0.034
LOC101882928
0.066
CABZ01075068.1
-0.029
BX571772.1
0.060
rasgef1ba
-0.026
LOC101885885
0.059
col28a2a
-0.025
XLOC-001638
0.057
slbp
-0.025
LOC100002283
0.054
tpm4a
-0.025
LO018564.1
0.049
cx43.4
-0.024
LOC110439834
0.046
selenoh
-0.024
si:ch211-286b4.4
0.046
cldn5a
-0.024
opn7b
0.046
eif4ebp3l
-0.024
CABZ01070852.2
0.046
hmgb2a
-0.024
mir125b-3
0.046
si:ch211-286o17.1
-0.024
tdp2a
0.045
oc90
-0.024
ckbb
0.043
cdx4
-0.024
CR545469.1
0.043
wnt11r
-0.023
cxcl19
0.043
nr2f6b
-0.023
rtn1b
0.043
stmn1a
-0.023
ywhag2
0.043
slc1a3a
-0.022
znf1000
0.042
BX001014.2
-0.022
CABZ01017717.1
0.041
fstl1a
-0.022
ywhah
0.041
meis1a
-0.022
si:ch73-236c18.2.1
0.041
si:dkey-42i9.4
-0.022
si:dkey-205h23.2
0.041
znfl2a
-0.021
zgc:153426
0.041
dla
-0.021
cpeb4b
0.040
nasp
-0.021
CU633478.1
0.040
dut
-0.021
tuba1c
0.039
krt18a.1
-0.021
dpysl3
0.039
aldob
-0.021
calr
0.039
sparc
-0.021
gng3
0.038
notch1a
-0.020
FQ311879.1
0.038
prss59.2
-0.020
mllt11
0.037
antxr1c
-0.020
pacsin1a
0.037
cdc6
-0.020
snap25a
0.037
col18a1a
-0.020
LOC103910984
0.037
si:ch211-170d8.2
-0.020