
LIM homeobox 2b
ZFIN 
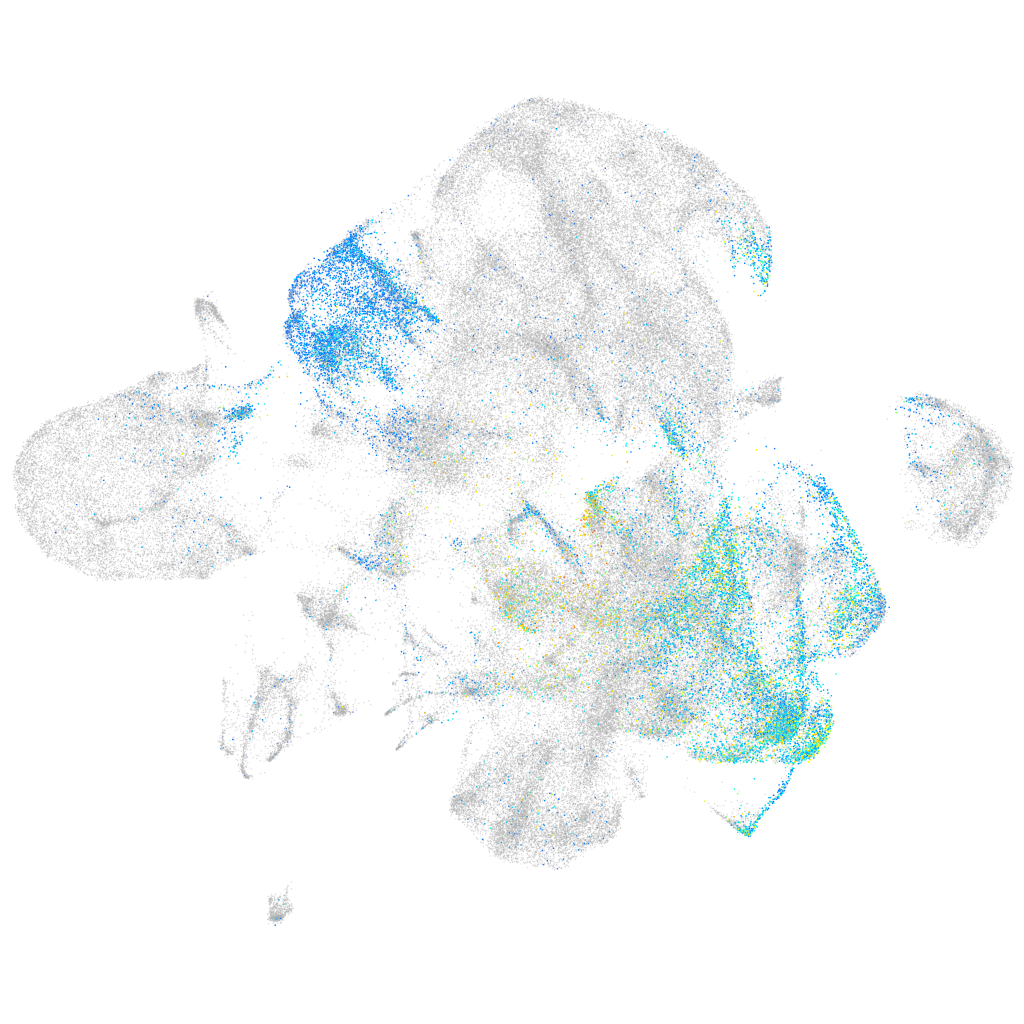
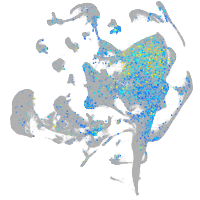
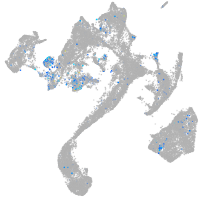
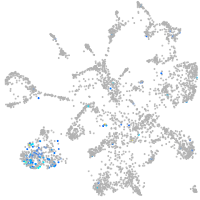
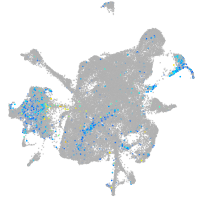
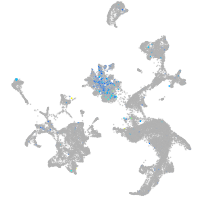
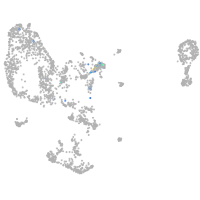
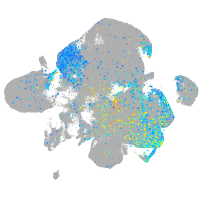
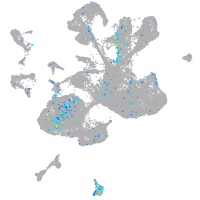
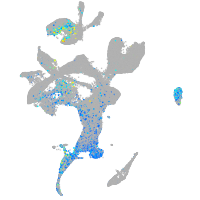
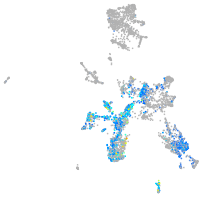
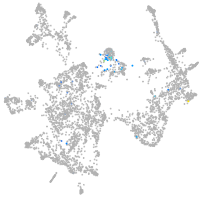
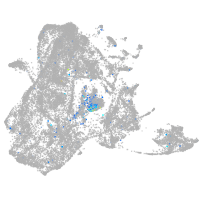
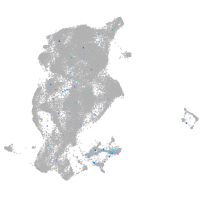
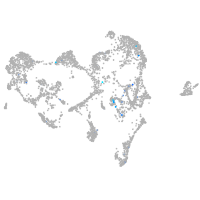
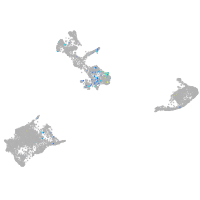
Gene expression UMAP


Expression by stage/cluster
Correlated gene expression
| Positive correlation | Negative correlation | ||
| Gene | r | Gene | r |
| lhx9 | 0.455 | sb:cb81 | -0.122 |
| barhl2 | 0.266 | hmgb2a | -0.116 |
| nrn1a | 0.265 | pcna | -0.115 |
| adcyap1b | 0.211 | id1 | -0.115 |
| barhl1a | 0.208 | pax3a | -0.108 |
| pou4f1 | 0.205 | npm1a | -0.106 |
| lef1 | 0.205 | sox3 | -0.103 |
| ebf3a | 0.205 | chaf1a | -0.102 |
| celf2 | 0.203 | msna | -0.101 |
| ebf1a | 0.191 | banf1 | -0.101 |
| cbfa2t3 | 0.182 | lig1 | -0.099 |
| evx2 | 0.178 | anp32b | -0.099 |
| mab21l1 | 0.177 | slc32a1 | -0.098 |
| evx1 | 0.177 | stmn1a | -0.098 |
| elavl3 | 0.171 | nop58 | -0.096 |
| ctnnbip1 | 0.169 | dkc1 | -0.096 |
| stmn1b | 0.166 | ccnd1 | -0.096 |
| tfap2d | 0.166 | gas1b | -0.093 |
| shox | 0.162 | rrm1 | -0.092 |
| scrt1b | 0.155 | fen1 | -0.092 |
| pbx3b | 0.155 | hspb1 | -0.091 |
| fez1 | 0.154 | cdca7a | -0.090 |
| gpm6ab | 0.154 | fbl | -0.090 |
| ebf1b | 0.150 | lhx1a | -0.090 |
| ptmaa | 0.148 | selenoh | -0.090 |
| tmsb | 0.145 | pax7a | -0.090 |
| chd4a | 0.144 | slc6a1b | -0.089 |
| nova2 | 0.144 | snu13b | -0.089 |
| gng2 | 0.143 | dek | -0.089 |
| tuba1c | 0.142 | akap12b | -0.089 |
| thsd7aa | 0.140 | mcm6 | -0.089 |
| epb41a | 0.139 | ccng1 | -0.088 |
| tubb5 | 0.138 | nasp | -0.088 |
| celf3a | 0.138 | vamp3 | -0.088 |
| rtn1a | 0.136 | mki67 | -0.087 |