
CBFA2/RUNX1 partner transcriptional co-repressor 3
ZFIN 
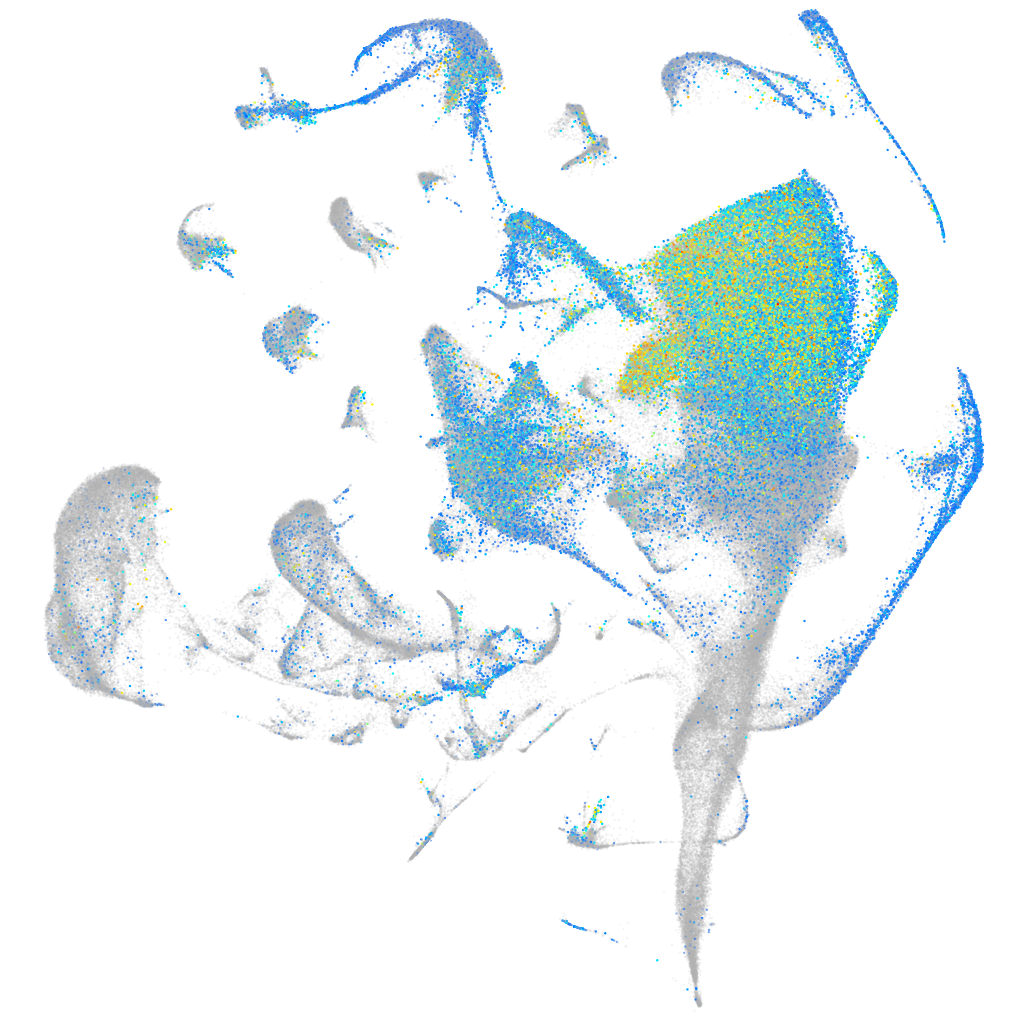
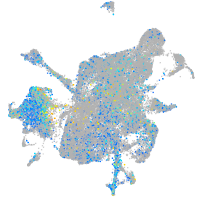
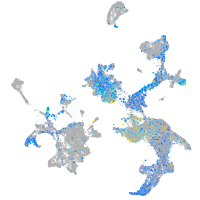
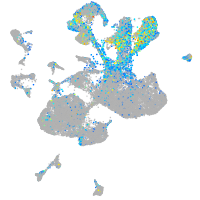
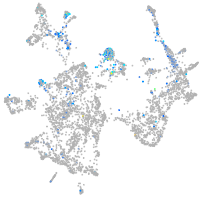
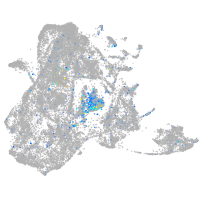
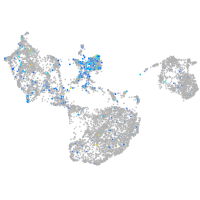
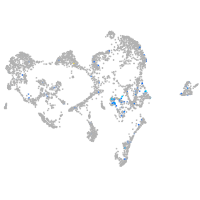
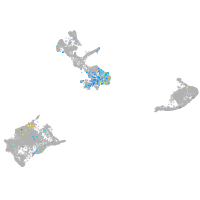
Gene expression UMAP


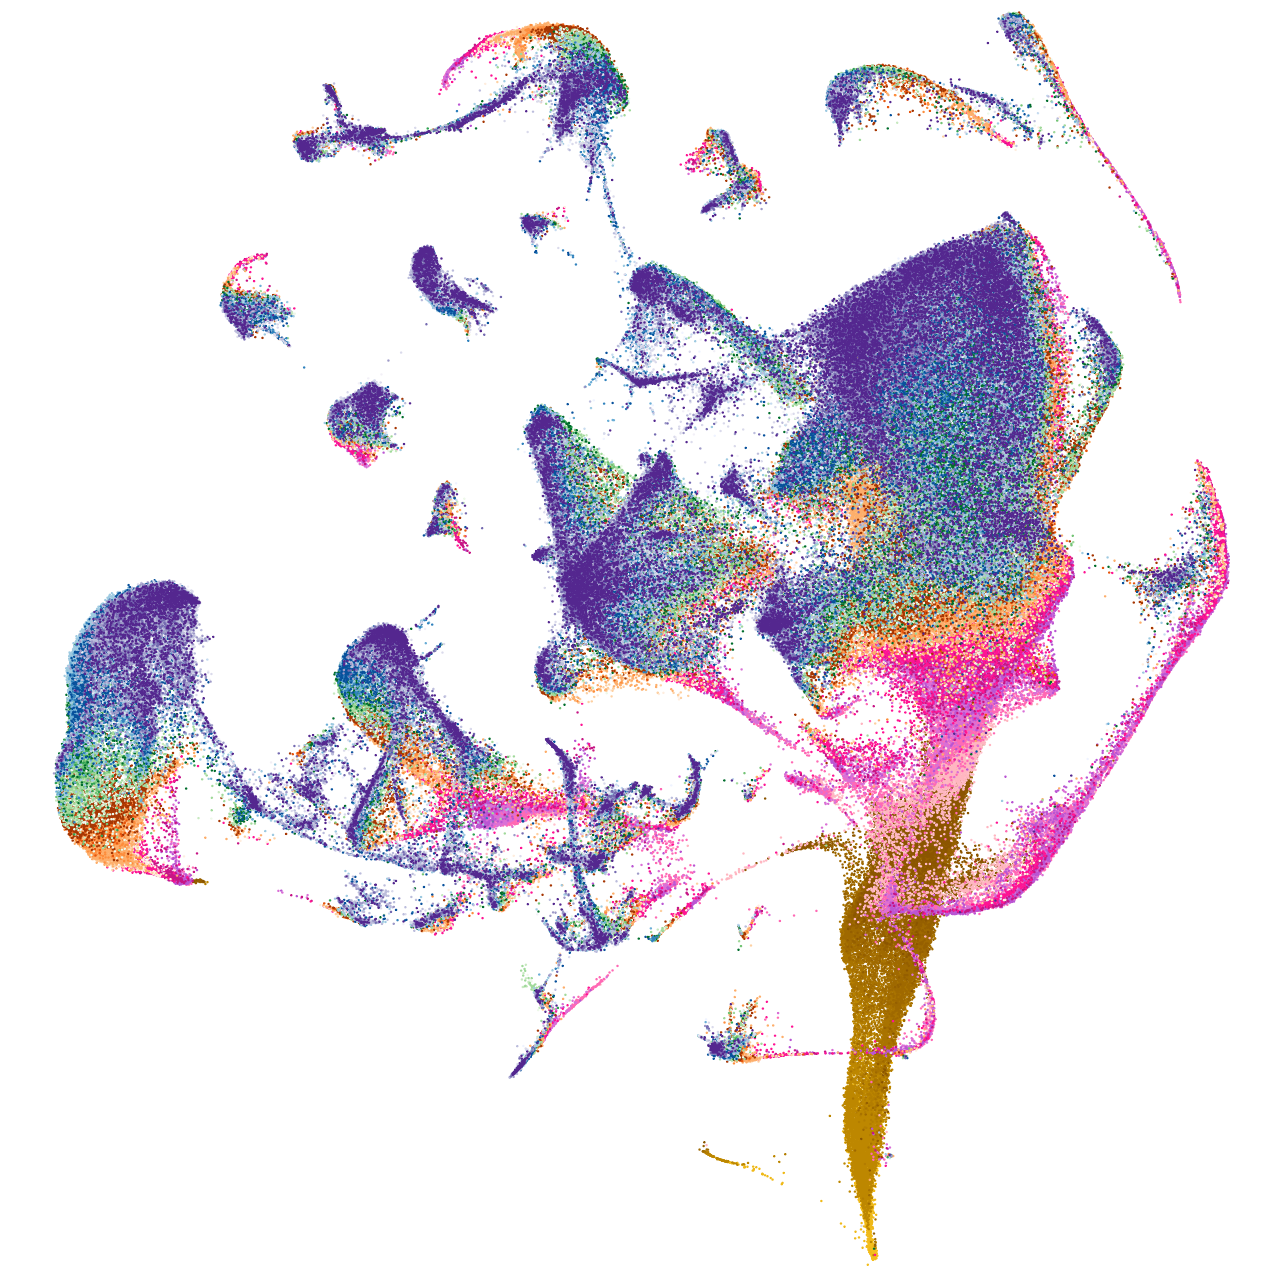


Expression by stage/cluster
Correlated gene expression
| Positive correlation | Negative correlation | ||
| Gene | r | Gene | r |
| elavl3 | 0.363 | aldob | -0.192 |
| stmn1b | 0.340 | id1 | -0.186 |
| rtn1a | 0.319 | ccng1 | -0.164 |
| tuba1c | 0.317 | hdlbpa | -0.161 |
| nova2 | 0.299 | sdc4 | -0.159 |
| tubb5 | 0.293 | vamp3 | -0.156 |
| gpm6ab | 0.290 | fosab | -0.154 |
| gng3 | 0.289 | npm1a | -0.153 |
| myt1b | 0.288 | bzw1b | -0.150 |
| tmsb | 0.288 | epcam | -0.150 |
| hmgb3a | 0.284 | atp1b1a | -0.147 |
| fez1 | 0.279 | banf1 | -0.144 |
| gpm6aa | 0.279 | eif4ebp3l | -0.144 |
| si:dkey-276j7.1 | 0.279 | cfl1l | -0.142 |
| gng2 | 0.278 | eef1da | -0.141 |
| myt1a | 0.275 | nop58 | -0.141 |
| tmeff1b | 0.274 | dkc1 | -0.140 |
| zc4h2 | 0.274 | tuba8l | -0.139 |
| elavl4 | 0.267 | fbl | -0.136 |
| dpysl3 | 0.266 | rsl1d1 | -0.136 |
| ywhah | 0.266 | selenoh | -0.136 |
| ebf3a | 0.263 | cd9b | -0.135 |
| tuba1a | 0.261 | pcna | -0.132 |
| ckbb | 0.257 | aldh9a1a.1 | -0.131 |
| csdc2a | 0.254 | ccnd1 | -0.131 |
| sncb | 0.254 | nop10 | -0.131 |
| adam22 | 0.251 | lig1 | -0.130 |
| rtn1b | 0.250 | chaf1a | -0.129 |
| celf3a | 0.249 | f11r.1 | -0.129 |
| id4 | 0.249 | gsta.1 | -0.129 |
| celf2 | 0.248 | cd63 | -0.128 |
| chd4a | 0.248 | si:ch211-286b5.5 | -0.128 |
| stx1b | 0.246 | zfp36l1a | -0.127 |
| scrt1a | 0.244 | apoeb | -0.126 |
| scrt2 | 0.244 | cast | -0.126 |