Daniocell
ino80db (pigment cells)
INO80 complex subunit Db
ZFIN
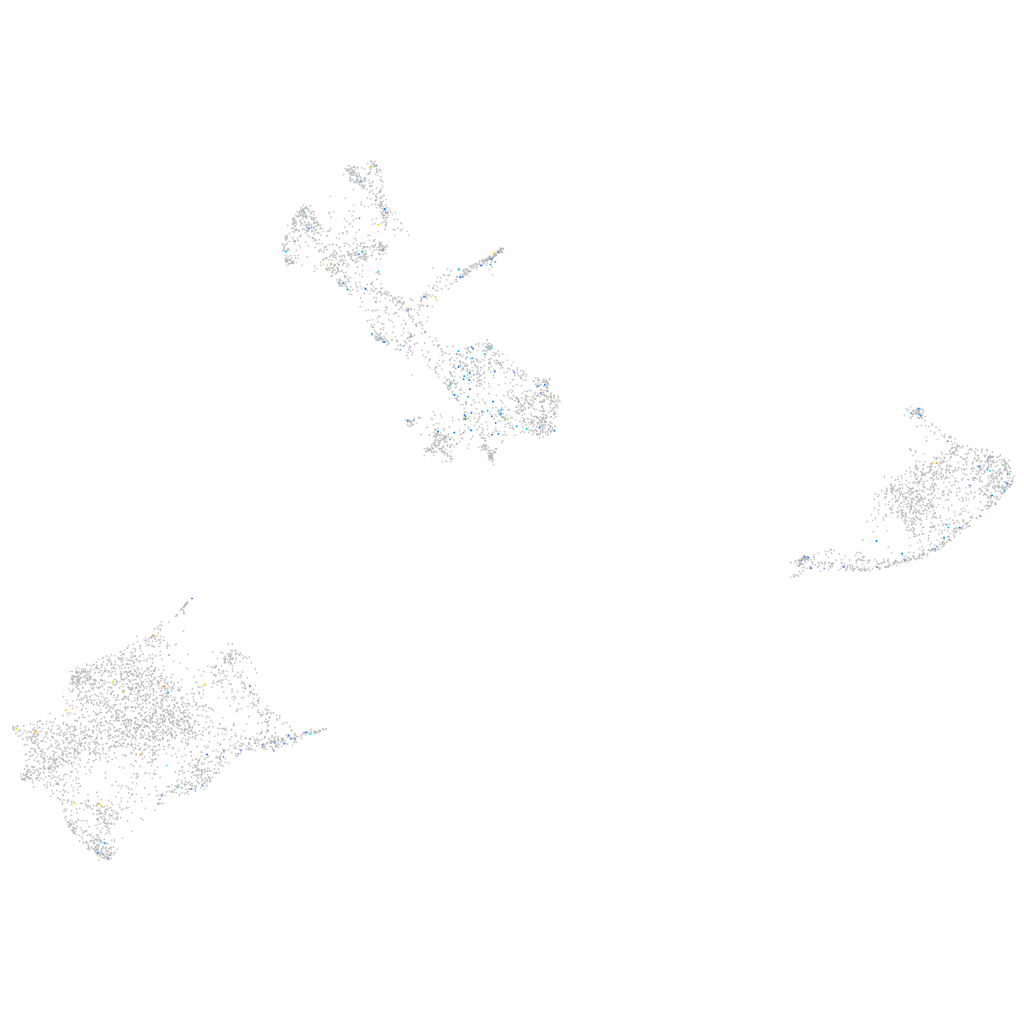
Gene expression UMAP
Display:
Expression
Stage
Other cell groups
all cells
blastomeres
PGCs
endoderm
axial mesoderm
muscle
mural cells /
non-skeletal muscle
mesenchyme
hematopoietic /
vasculature
pronephros
neural
spinal cord / glia
eye
taste / olfactory
otic / lateral line
epidermis
periderm
fin
ionocytes / mucous
pigment cells
Expression by stage/cluster
Correlated gene expression
Positive correlation
Negative correlation
Gene
r
Gene
r
LOC101887000
0.162
gch2
-0.045
pcsk5a
0.155
si:dkey-251i10.2
-0.042
si:dkeyp-80c12.5
0.144
gpd1b
-0.042
casc1
0.143
zgc:110339
-0.040
BX901922.1
0.137
gstp1
-0.038
si:dkey-21e2.7
0.137
csrp2
-0.035
exorh
0.134
actb2
-0.035
RF00319
0.129
cyb561a3b
-0.035
bdh2
0.127
slc22a7a
-0.034
TCERG1L
0.126
aldob
-0.034
si:ch211-203k16.3
0.125
akr1b1
-0.033
CABZ01077555.1
0.124
C12orf75
-0.032
BX649481.1
0.118
LOC110437731
-0.031
LOC110438040
0.116
bco1
-0.030
otog
0.113
pts
-0.030
agpat9l
0.110
CABZ01021592.1
-0.030
CABZ01003344.1
0.108
dio3a
-0.029
si:ch211-117n7.6
0.107
tspan36
-0.029
tmem121ab
0.106
vps26a
-0.028
ptpdc1b
0.103
gstt1a
-0.027
XLOC-002305
0.103
rps8a
-0.027
impg1a
0.102
ckmb
-0.026
grm2a
0.102
krt4
-0.026
XLOC-011900
0.098
pcbd1
-0.025
hgfa
0.098
slc38a5b
-0.025
LOC100537389
0.096
sptbn1
-0.025
pomca
0.095
tmem130
-0.025
ccdc82
0.094
zgc:153031
-0.024
CR848705.1
0.094
FO704772.2
-0.024
spata4
0.093
scarb1
-0.024
RF00411
0.093
hbbe1.2
-0.024
guca1c
0.093
pir
-0.024
six7
0.092
fxyd6l
-0.024
XLOC-018236
0.092
TMEM19
-0.023
inip
0.091
nrgna
-0.023