Daniocell
ino80db (taste / olfactory)
INO80 complex subunit Db
ZFIN
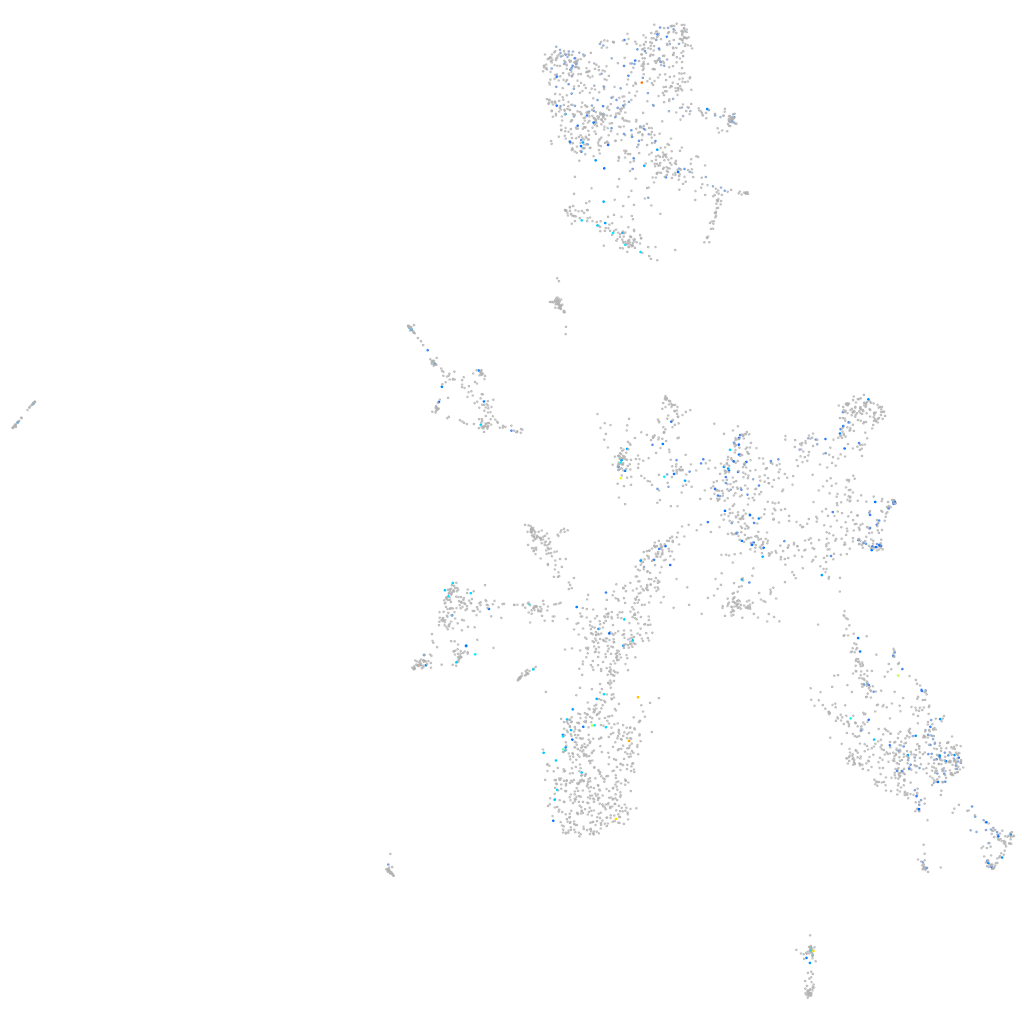
Gene expression UMAP
Display:
Expression
Stage
Other cell groups
all cells
blastomeres
PGCs
endoderm
axial mesoderm
muscle
mural cells /
non-skeletal muscle
mesenchyme
hematopoietic /
vasculature
pronephros
neural
spinal cord / glia
eye
taste / olfactory
otic / lateral line
epidermis
periderm
fin
ionocytes / mucous
pigment cells
Expression by stage/cluster
Correlated gene expression
Positive correlation
Negative correlation
Gene
r
Gene
r
trpc6a
0.159
col1a2
-0.046
si:dkeyp-98a7.8
0.151
gpd1c
-0.044
CR927456.1
0.140
nras
-0.041
si:dkey-21a6.5
0.131
sqor
-0.040
fdxacb1
0.130
pmp22a
-0.040
LOC110437773
0.119
gnmt
-0.040
XLOC-009525
0.117
col11a1a
-0.039
BX072576.1
0.117
cldn1
-0.038
ky
0.117
rpl36
-0.038
tdrd1
0.114
col1a1a
-0.038
LOC110439377
0.113
hbegfa
-0.038
LOC108179692
0.112
rps28
-0.037
slc20a1a
0.110
rplp2
-0.037
si:rp71-17i16.4
0.110
egfl6
-0.037
BX323855.1
0.105
cebpd
-0.036
smtnb
0.105
fam114a2
-0.035
stim2a
0.103
rpl7a
-0.035
or126-5
0.102
eif4ebp3l
-0.035
CABZ01052570.1
0.101
col18a1a
-0.035
zgc:172122
0.099
mafaa
-0.035
XLOC-008823
0.099
tnn
-0.034
pcdh11
0.099
slc25a34
-0.034
si:dkey-236e20.3
0.098
si:dkey-261e22.4
-0.034
LOC110438438
0.096
amdhd2
-0.034
COLEC10
0.096
rap1ab
-0.034
zgc:152670
0.096
fabp10a
-0.033
LOC103908672
0.096
postnb
-0.033
BX572078.1
0.095
mfsd5
-0.033
capn3b
0.094
mtif3
-0.033
chst7
0.094
rpl22
-0.033
cthrc1a
0.094
cish
-0.033
LOC110437984
0.093
wdr83
-0.033
guca1b
0.092
ftsj1
-0.033
si:ch211-171l17.4
0.092
frs2b
-0.033
LOC101885706
0.091
rpl11
-0.033