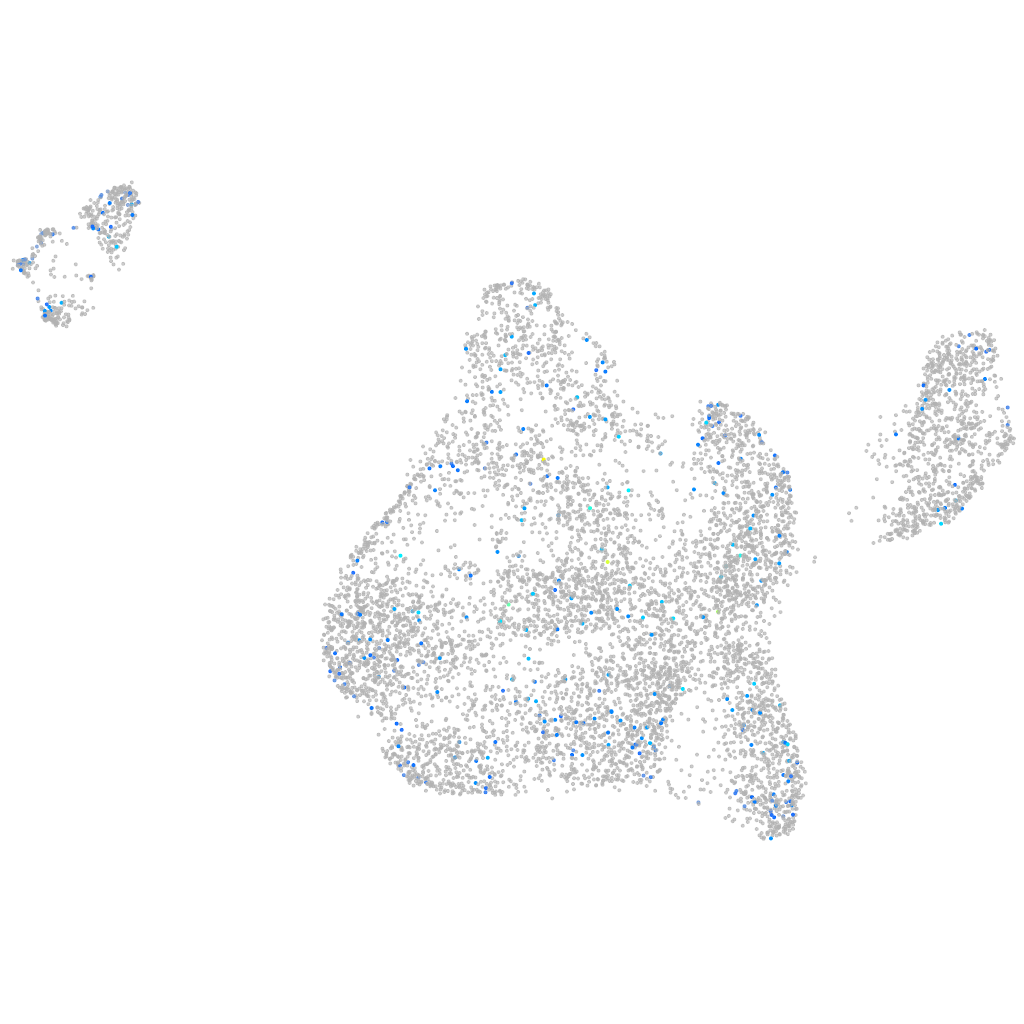
Daniocell
ino80db (blastomeres)
INO80 complex subunit Db
ZFIN
Gene expression UMAP
Display:
Expression
Stage
Other cell groups
all cells
blastomeres
PGCs
endoderm
axial mesoderm
muscle
mural cells /
non-skeletal muscle
mesenchyme
hematopoietic /
vasculature
pronephros
neural
spinal cord / glia
eye
taste / olfactory
otic / lateral line
epidermis
periderm
fin
ionocytes / mucous
pigment cells
Expression by stage/cluster
Correlated gene expression
Positive correlation
Negative correlation
Gene
r
Gene
r
grm1a
0.100
NC-002333.4
-0.036
XLOC-005350
0.094
marcksl1b
-0.034
htr1d
0.092
polr3gla
-0.033
LOC101882847
0.090
aqr
-0.032
LOC103911994
0.090
sap18
-0.031
apof
0.089
pnkp
-0.030
plekhh2
0.085
eny2
-0.029
LOC407643
0.084
mrm2
-0.026
zmp:0000000760
0.084
si:ch211-216l23.2
-0.026
neurod4
0.082
ppie
-0.026
ttyh1
0.082
hnrnpr
-0.025
cnga2a
0.082
zgc:66388
-0.025
lcp2a
0.078
si:dkey-185e18.7
-0.025
tac4
0.078
pdlim1
-0.025
BX324153.1
0.077
cxcr4a
-0.025
zgc:153968
0.074
XLOC-020843
-0.025
adrb2b
0.072
CU855889.2
-0.025
pcsk9
0.071
acsf2
-0.025
fam69b
0.071
rps28
-0.024
si:dkey-78k11.9
0.070
si:ch1073-80i24.3
-0.024
ctgfb
0.068
fam192a
-0.024
si:ch73-302o18.2
0.068
s100a1
-0.024
si:ch211-244e12.7
0.067
si:ch211-196l7.4
-0.024
LOC103908820
0.067
napab
-0.023
ccl39.1
0.066
hint2
-0.023
cnn1a
0.066
c1qbp
-0.023
LOC108183930
0.066
gtf2e2
-0.023
RF00096
0.065
fubp1
-0.023
CR936408.1
0.065
nelfe
-0.023
LOC100331359
0.065
ak4
-0.023
slc2a11b
0.065
si:dkey-151g10.6
-0.023
agrp
0.065
ints10
-0.023
tppp2
0.064
si:ch73-132k15.2
-0.023
mir375-2
0.063
grhpra
-0.023
ftr58
0.063
si:ch73-1a9.3
-0.023