Daniocell
ino80db (glial cells / spinal cord)
INO80 complex subunit Db
ZFIN
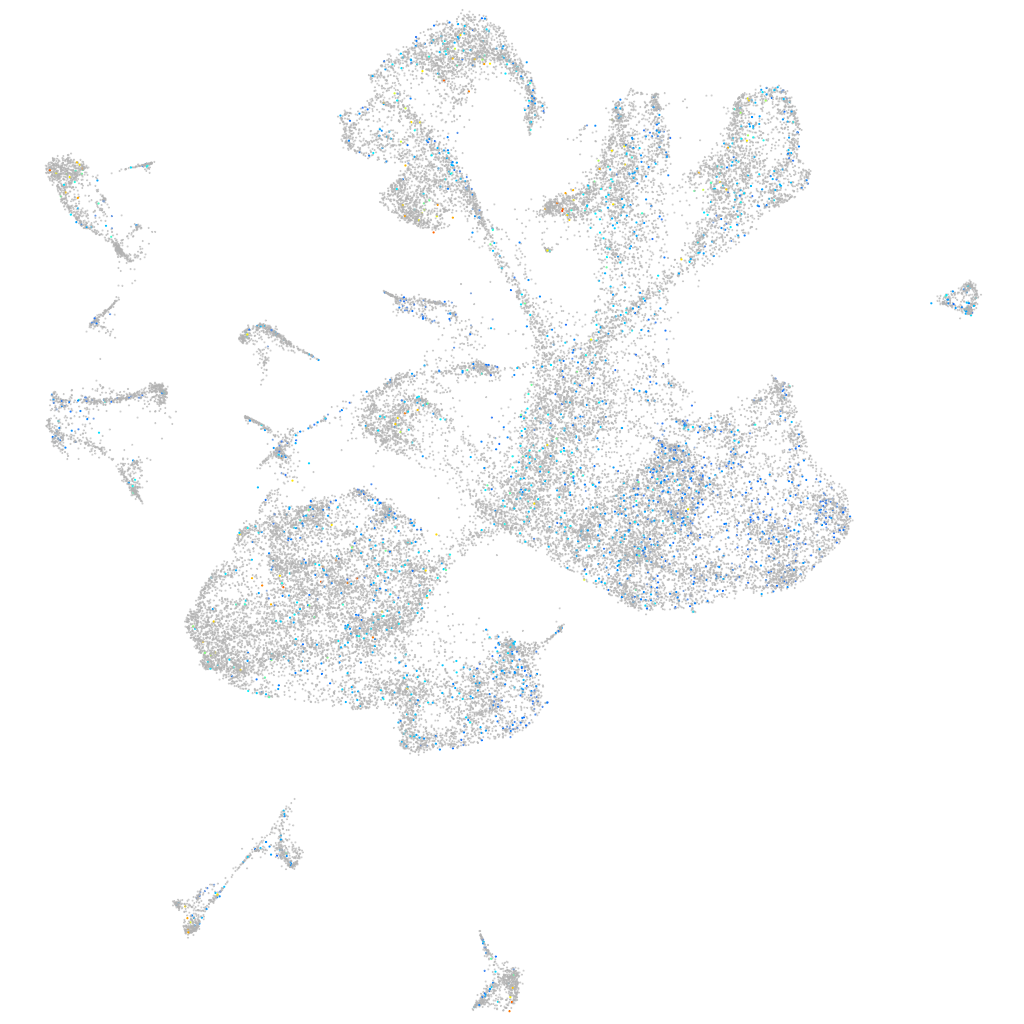
Gene expression UMAP
Display:
Expression
Stage
Other cell groups
all cells
blastomeres
PGCs
endoderm
axial mesoderm
muscle
mural cells /
non-skeletal muscle
mesenchyme
hematopoietic /
vasculature
pronephros
neural
spinal cord / glia
eye
taste / olfactory
otic / lateral line
epidermis
periderm
fin
ionocytes / mucous
pigment cells
Expression by stage/cluster
Correlated gene expression
Positive correlation
Negative correlation
Gene
r
Gene
r
BX294110.1
0.057
cd63
-0.032
CU571315.2
0.042
ptn
-0.025
ggact.2
0.041
fabp7a
-0.023
LOC101884093
0.039
slc6a11b
-0.023
abcb4
0.038
cox4i2
-0.022
marcksb
0.038
si:ch211-66e2.5
-0.022
BX649516.5
0.036
nck1a
-0.022
ptmab
0.036
sept8b
-0.021
LOC103909969
0.035
gpr37l1b
-0.021
CR936240.1
0.034
glula
-0.021
si:ch211-288g17.3
0.034
ptgdsb.2
-0.021
si:ch211-127n13.2
0.033
gpd1b
-0.020
LOC108179692
0.033
atp1a1b
-0.020
LO018605.1
0.033
cyp3c1
-0.020
LOC103908938
0.032
slc1a2b
-0.020
si:ch211-111e20.1
0.032
cx43
-0.020
mex3b
0.032
cebpd
-0.020
fgf10b
0.032
dap1b
-0.020
arl13a
0.032
ppap2d
-0.020
LOC101885096
0.032
igfbp5b
-0.020
tubb2b
0.032
slc25a18
-0.020
LOC101885952
0.032
slc3a2a
-0.019
or106-8
0.032
mdkb
-0.019
tet3
0.032
cdo1
-0.019
zc4h2
0.032
mgll
-0.019
cenpf
0.032
cspg5b
-0.019
hmgb3a
0.031
smox
-0.019
LOC101886928
0.031
nog2
-0.018
hmgb1a
0.031
hspb15
-0.018
BX000701.2
0.031
slc1a3b
-0.018
LOC103910198
0.031
si:dkey-85k7.7
-0.018
BX537305.1
0.031
tmem176
-0.018
CR925773.1
0.031
lpin1
-0.018
plk1
0.031
slc4a4a
-0.018
tlr5b
0.030
mfge8a
-0.018