Daniocell
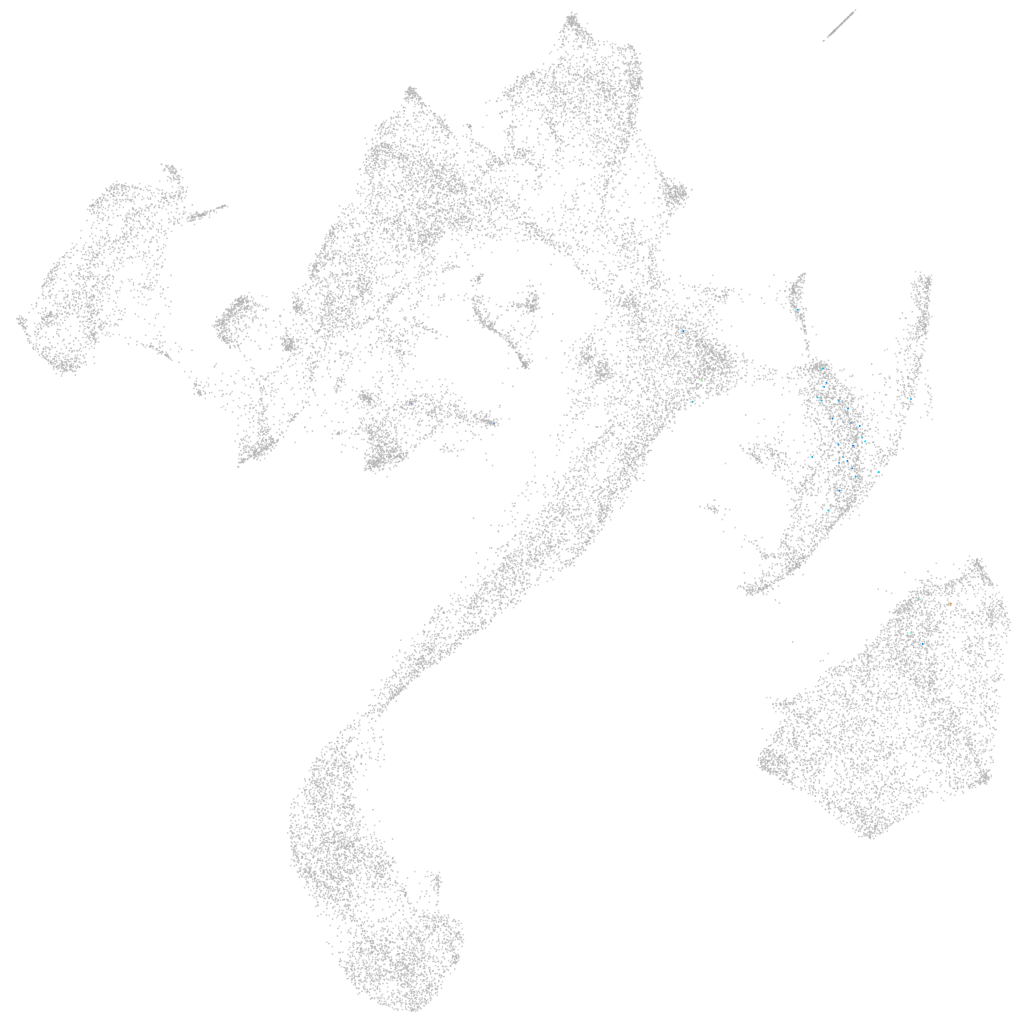
gpr132a (muscle)
G protein-coupled receptor 132a
ZFIN
Gene expression UMAP
Display:
Expression
Stage
Other cell groups
all cells
blastomeres
PGCs
endoderm
axial mesoderm
muscle
mural cells /
non-skeletal muscle
mesenchyme
hematopoietic /
vasculature
pronephros
neural
spinal cord / glia
eye
taste / olfactory
otic / lateral line
epidermis
periderm
fin
ionocytes / mucous
pigment cells
Expression by stage/cluster
Correlated gene expression
Positive correlation
Negative correlation
Gene
r
Gene
r
LOC103909381.1
0.169
fabp3
-0.030
si:dkeyp-3f10.16
0.155
sparc
-0.026
si:rp71-1c10.8
0.147
actc1b
-0.025
si:ch211-132g1.1
0.142
eif4a1b
-0.023
XLOC-002665
0.114
si:dkey-16p21.8
-0.022
LOC108179803
0.111
bhmt
-0.022
zgc:153659
0.107
pabpc4
-0.022
RF00431
0.099
ak1
-0.021
BX649349.1
0.096
eno1a
-0.021
si:dkey-9a6.4
0.083
vdac3
-0.020
LOC108183434
0.080
tpi1b
-0.020
LOC110437781
0.075
tmem38a
-0.020
si:ch211-182p11.1
0.075
atp2a1
-0.020
LOC103910570
0.075
aldoab
-0.020
si:dkeyp-97a10.1
0.072
ckma
-0.020
tbx6
0.070
ckmb
-0.020
fgf14
0.069
celf2
-0.020
tlr20.2
0.067
vwde
-0.019
FQ377903.1
0.066
acta1b
-0.019
BX511129.2
0.066
col1a2
-0.019
fam83c
0.065
mylpfa
-0.019
XLOC-005004
0.061
ttn.2
-0.019
XLOC-004006
0.060
gamt
-0.019
myf5
0.059
jun
-0.019
si:ch73-335m24.5
0.059
si:ch211-140m22.7
-0.019
her1
0.059
ldb3a
-0.019
si:dkey-112g5.12
0.058
srl
-0.019
LOC110437859
0.057
ndufb2
-0.019
kbtbd7
0.057
FQ323156.1
-0.019
XLOC-021944
0.056
tnnc2
-0.019
LOC103909053
0.056
plecb
-0.018
LOC108179085
0.056
cav3
-0.018
msgn1
0.055
pmp22a
-0.018
BX005254.3
0.054
fxyd6l
-0.018
ism1
0.054
gapdh
-0.018