Daniocell
gas2a (glial cells / spinal cord)
growth arrest-specific 2a
ZFIN
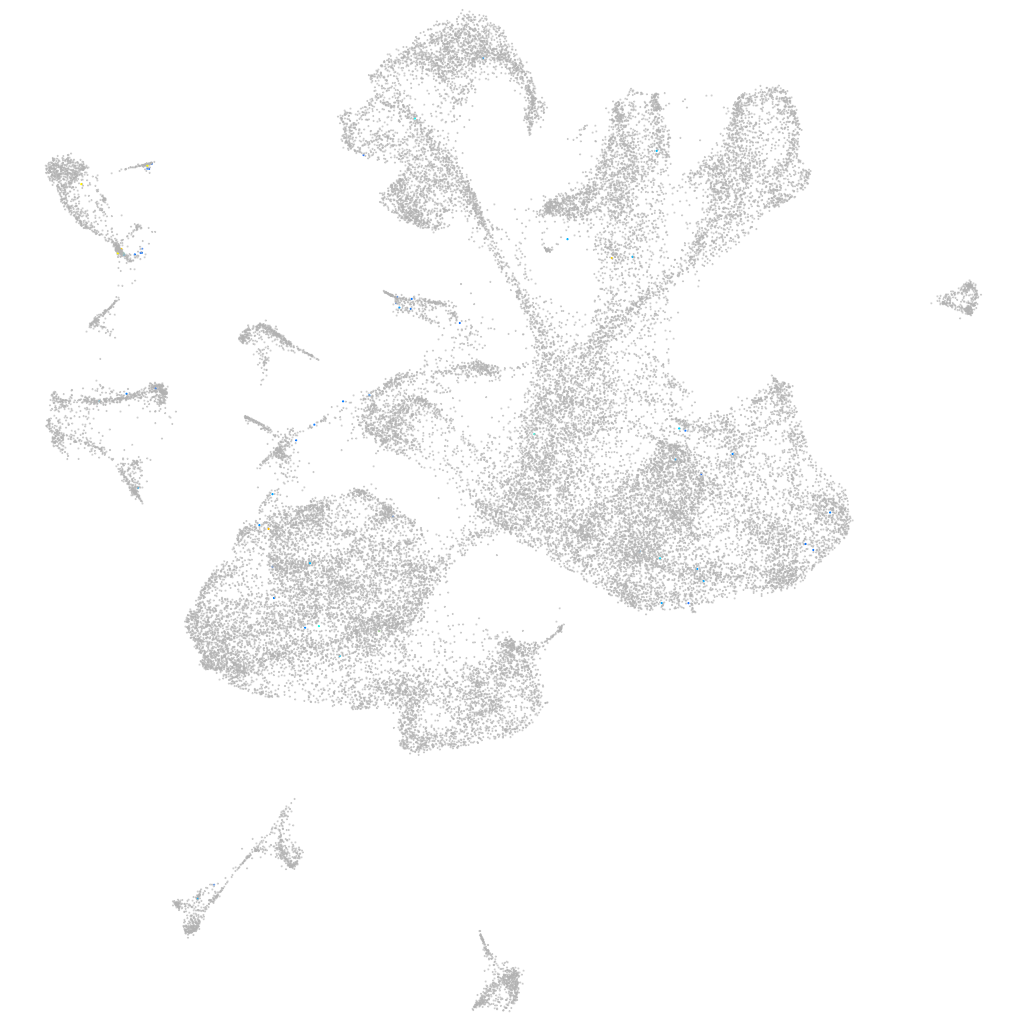
Gene expression UMAP
Display:
Expression
Stage
Other cell groups
all cells
blastomeres
PGCs
endoderm
axial mesoderm
muscle
mural cells /
non-skeletal muscle
mesenchyme
hematopoietic /
vasculature
pronephros
neural
spinal cord / glia
eye
taste / olfactory
otic / lateral line
epidermis
periderm
fin
ionocytes / mucous
pigment cells
Expression by stage/cluster
Correlated gene expression
Positive correlation
Negative correlation
Gene
r
Gene
r
CU693481.1
0.238
nova2
-0.016
BX323087.2
0.142
si:ch73-1a9.3
-0.014
f7
0.135
si:ch73-30b17.2
-0.014
il19l
0.131
smarce1
-0.014
LOC101884781
0.121
hbae1.1
-0.013
zte38
0.120
rcor2
-0.013
zpld1a
0.111
gadd45gb.1
-0.012
LOC108181656
0.109
pou3f1
-0.012
LOC101886779
0.096
kdm6ba
-0.012
tnxbb
0.096
hmgn6
-0.012
ankrd31
0.086
gkap1
-0.012
eef1a2
0.084
pcf11
-0.012
otog
0.083
irx5a
-0.012
zpld1b
0.083
sox3
-0.012
zgc:113223
0.079
tp53inp2
-0.012
XLOC-043976
0.075
plagl2
-0.011
CU658285.1
0.072
notch1a
-0.011
LOC110440165
0.072
draxin
-0.011
zgc:171750
0.070
ewsr1b
-0.011
LOC103911803
0.070
meis2b
-0.011
si:ch211-207e19.2
0.069
eif5b
-0.010
coch
0.066
smarcc1a
-0.010
si:ch73-249k16.4
0.065
FQ976913.1
-0.010
acana
0.064
ttyh2
-0.010
ptger2b
0.059
ncam1a
-0.010
six2b
0.059
hmgb3a
-0.010
si:dkey-222f2.1
0.059
sall4
-0.010
LOC103910371
0.058
mapk12b
-0.010
a2ml
0.058
sertad2a
-0.010
moxd1
0.057
ascl1b
-0.010
hpn
0.056
CU104709.1
-0.010
zgc:91968
0.056
si:dkey-56m19.5
-0.010
CU928073.1
0.055
si:ch211-154o6.2
-0.010
urad
0.055
marcksb
-0.010
mb
0.054
inavaa
-0.010