Daniocell
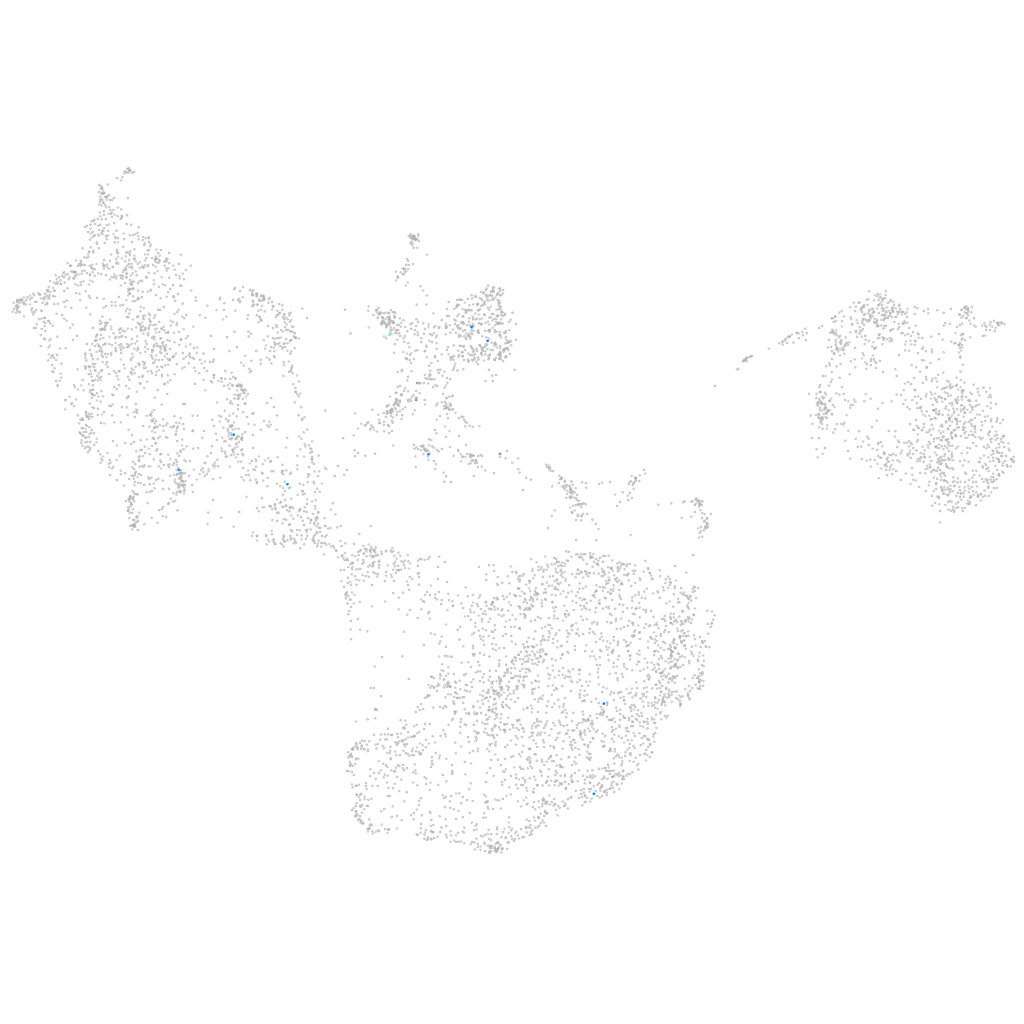
gas2a (fin)
growth arrest-specific 2a
ZFIN
Gene expression UMAP
Display:
Expression
Stage
Other cell groups
all cells
blastomeres
PGCs
endoderm
axial mesoderm
muscle
mural cells /
non-skeletal muscle
mesenchyme
hematopoietic /
vasculature
pronephros
neural
spinal cord / glia
eye
taste / olfactory
otic / lateral line
epidermis
periderm
fin
ionocytes / mucous
pigment cells
Expression by stage/cluster
Correlated gene expression
Positive correlation
Negative correlation
Gene
r
Gene
r
BX649423.2
0.538
selenow1
-0.024
ifit9
0.528
tmem54a
-0.022
XLOC-003375
0.329
CABZ01072614.1
-0.022
LOC110438172
0.307
tob1a
-0.021
cnga2a
0.298
rgcc
-0.021
LOC101886868
0.298
chmp2a
-0.020
RNF219
0.297
icn2
-0.020
bdkrb2
0.290
aqp3a
-0.020
CT955967.1
0.284
oclna
-0.019
si:dkeyp-9d4.2
0.277
rcn1
-0.019
LOC101885749
0.271
and2
-0.019
si:dkey-88e18.8
0.261
rhbdl2
-0.019
BX511073.1
0.261
nectin1b
-0.019
si:dkey-74k8.4
0.252
si:dkey-222f8.3
-0.019
si:dkey-237i9.8
0.239
adipor2
-0.019
CABZ01058277.1
0.236
furina
-0.019
RF00408
0.234
pvalb2
-0.019
cdc42ep1b
0.209
elovl1b
-0.018
fhl5
0.206
bambib
-0.018
tnfsf10l3
0.203
si:dkey-262k9.2
-0.018
XLOC-043962
0.197
icn
-0.018
LOC110438400
0.193
tmem18
-0.018
map3k9
0.191
tspan15
-0.018
LOC108179116
0.190
actc1b
-0.018
GRB14
0.190
si:ch211-246m6.5
-0.018
zranb1a
0.183
angptl7
-0.018
rilpl1
0.176
perp
-0.018
si:dkey-34d22.2
0.175
mgst1.2
-0.017
tgm1l2
0.173
tmpoa
-0.017
ugt5c3
0.171
limd2
-0.017
ccl38a.4
0.169
CABZ01092156.1
-0.017
rfx6
0.168
arpc1a
-0.017
gfi1ab
0.168
ezrb
-0.017
si:cabz01071909.2
0.167
txn
-0.017
si:ch73-285p12.4
0.167
aldoaa
-0.017